
Background
The optomotor reflex is an animal’s tendency to stabilise themselves relative to visual information. We can use this to our advantage in simple behavioural experiments to work out the limits of an animal’s visual capabilities, such as its acuity or ability to see colour contrasts.
We have developed a customisable low-cost optomotor apparatus (AKA “optomotor drum”) , which can be built from readily accessible materials and 3D printed parts. For further details of the background and scope of this resource see our publication: Caves, E.M., Troscianko, J. and Kelley, L.A. (in press) A customizable, low-cost optomotor apparatus: a powerful tool for behaviourally measuring visual capability, Methods in Ecology and Evolution. DOI: 10.1111/2041-210X.13449
This video guide takes you through the entire assembly process:
Worked Example
Here we illustrate the process in detail of constructing and programming the optomotor apparatus, creating stimuli, choosing parameters for the experiment such as drum rotation speed, and collecting data, using an example from our own research. This worked example can serve as a guide to researchers wishing to conduct their own optomotor experiments.
Generating a hypothesized acuity for the species of interest
We wanted to measure acuity in a species of swordtail fish (Xiphophorus spp.) where individuals are between 3 and 16cm in total length. In the literature, we found a published regression between body size (total length) and acuity in ray-finned fish (Caves, Sutton, & Johnsen, 2017). Using this regression, we predicted that acuity in the smallest individuals of our species would be approximately 3 cycles per degree (cpd), and in the largest individuals could be as high as 5 cpd. The published regression was, however, based on anatomical estimates of acuity (i.e. those produced using the density of the photoreceptors or retinal ganglion cells), which can give estimates of acuity that are higher than are found with behavioural methods, such as optomotor. Thus, to account for this, and to ensure that we tested a wide range of spatial frequencies likely to encompass the real acuity value, we created stimuli of spatial frequencies from 1 to 6 cpd.
We chose an experimental arena that was 300mm wide and which we could fill with water to a height of 100mm. This allowed sufficient water volume for the needs of our fish species. However, to keep the fish near the centre of the arena whilst still allowing it to move relatively freely, we also used a second cylinder (100mm diameter) to constrain the animal. Based on this setup, we required an optomotor apparatus capable of supporting an experimental arena that was 300mm in diameter (and thus stimuli that are slightly larger in diameter than that, to allow them to rotate freely around the arena) and weighed approximately 7kg.
Based on our experimental needs, the 3D printing templates provided here are for an apparatus that supports an arena 300mm in diameter and stimuli 340mm in diameter. However, these parts can support any diameter of arena and stimuli smaller than 340mm. For example, if performing optomotor experiments on a small animal (for example an insect), it may be prudent to choose a smaller arena in which to confine the animal. No changes to the design provided are necessary to scale down, and the stimulus calculation spreadsheet (see supplemental material) can calculate stripe widths for any drum diameter. On the other hand, testing an animal that is larger or requires more space may require one to scale up our design. The size of the 3D-printed components can be altered and scaled up using open-source editing software such as Blender. The upper size limit for our design is one of weight, rather than diameter, as the central column can only support up to approximately 7kg; however, additional weight can be accommodated by printing the base bracket with thicker walls, or in solid plastic.
Constructing and programming the optomotor apparatus
We designed the optomotor apparatus so that it could be constructed affordably from 3D printed parts, readily available components, and with only basic tools (i.e. hex-keys/allen-keys, a craft knife, and a computer for programming the microcontroller). A full list of parts and their approximate cost is shown in Table 1, and a full demonstration of the assembly process is shown in the supplementary online video (above). Here we provide a brief overview of the assembly process, although we recommend viewing the video for a more detailed guide. Parts can be downloaded here.
3D printing of components
The 3D printed parts can be constructed using a standard “fused filament fabrication” (also known as “fused deposition modelling”) printer. The 3D parts are available as individual .stl models for use with the printer’s slicing software (here). Any standard plastic is likely to function adequately, such as ABS, PLA or PETg. We used ABS due it its strength and flexibility, with 0.2mm layer depth and 15% infill for all models. An advantage of ABS is the ability to use acetone vapour baths to partially dissolve the surface and improve layer lamination strength (which makes the parts stronger, particularly under pressure near bolts).
Apparatus Assembly
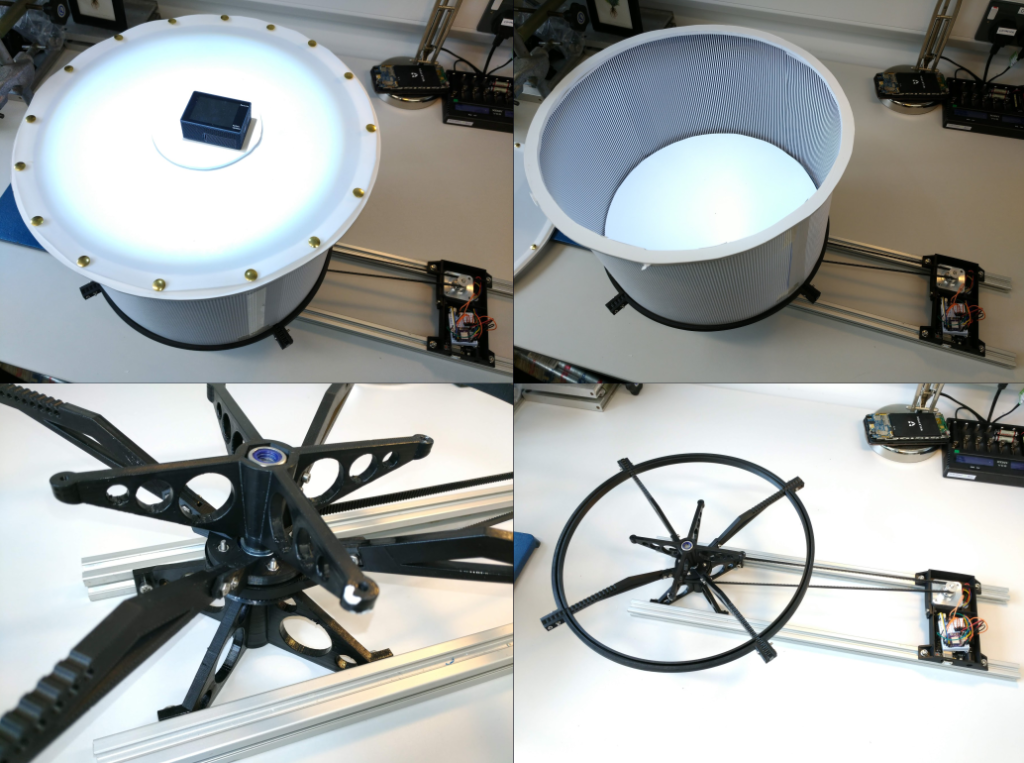
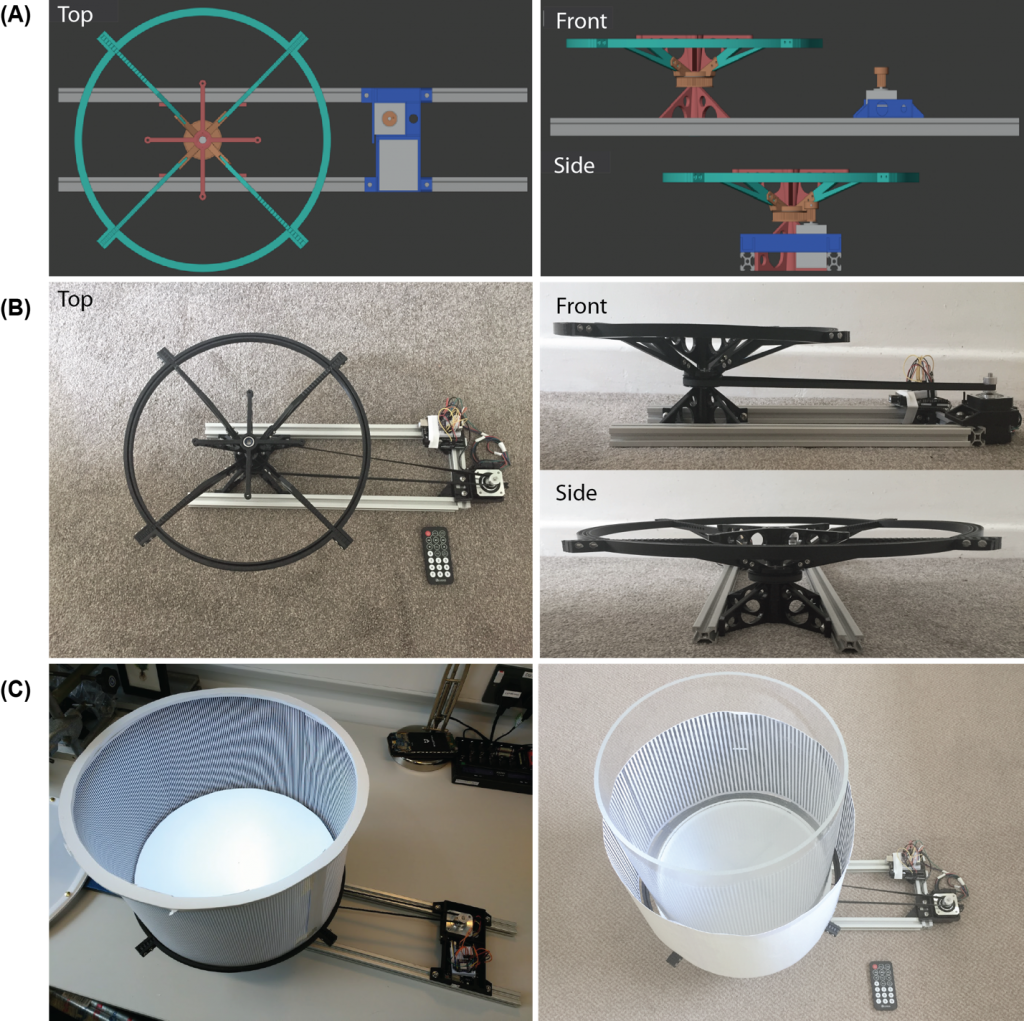
See Figure 1 for schematics and photographs of the assembled system. The bottom bracket and motor housing attach to two aluminium profile sections (commonly sold as 2020 t-slot profile), holding them 100mm apart. T-slot nuts and 10mm M5 bolts are used to secure these parts to the aluminium profile. A 100mm M10 bolt fits through the bottom bracket, holding the sealed bearing unit in place, and above this sits the top bracket, secured with an M10 lock-nut. The bearing is sandwiched between a pulley/sprocket with 80 teeth, and the drum’s arm hub (connected around the bearing unit using M3 nuts and 20mm bolts). Four arms attach to the hub, creating spokes of the drum wheel (using M3 nuts and 10mm bolts), and four arc sections create the outside of the wheel (using M3 nuts and 20mm bolts). The pulley is designed to fit a 6mm GT2 belt, connecting to the stepper motor with a 20-tooth pulley. Sliding the bottom bracket or motor housing parts away from each other allows for belt tension adjustment. The motor and 20-tooth pulley can also be moved up and down to match the height of the 80-tooth pulley on the drum.
Arena Assembly
For the size of drum we required (300mm diameter), the base of the drum was a circle of extruded clear acrylic (PMMA), 10mm thick and 320mm in diameter. (Note that a waterproof material such as acrylic is required to construct an arena for an aquatic animal. In the supplemental video, we also provide an example of how to construct an arena for a terrestrial animal, in which case the material need not be waterproof and can be constructed of a material like foamed PVC of 5mm thickness, which can be cut with a craft knife.) The base must be a homogeneous, uniform colour with no visual rotational cues. To finish creating the arena, we acquired a 300mm long by 300mm diameter section of transparent acrylic tube, and glued this to the base using aquarium silicone. In the centre of this we positioned a second, internal tank made from 100mm diameter acrylic tube. This was secured to the bottom of the tank using a 3D printed part that allowed free water flow between the large external and small internal tank.
Electronics & Wiring
An optomotor drum requires smooth, slow, and precise rotation. We therefore used a stepper motor that offers control, and a combination of gearing and micro-stepping to achieve consistent fluid rotation at speeds lower than 1 revolution per minute (rpm). Micro-stepping is the use of graded opposing currents to hold the motor at intermediate angles between steps. The stepper motor is powered and controlled by a driver board, which is in turn given instructions by an Arduino microcontroller. The Arduino in turn receives user commands via an infrared remote control. Table 1 lists the parts we used, Figure 2 shows the wiring diagram, and the supplementary online video guide gives further specific construction instructions. There are many alternative Arduino boards or other microcontrollers which will be capable of running the drum. For example, a Raspberry Pi could be used to integrate your drum with functions provided by a full operating system, such as using on-the-fly video tracking (e.g. OpenCV), or a rotary encoder to control drum rotation. An additional alternative is to have the Arduino communicate with a standard computer via the USB port (using the serial connection). The electronics can be assembled using a solderless prototyping breadboard, meaning that no soldering is required. However, for long-term use (particularly in humid/damp environments) we recommend soldering all the contacts to make the system more robust. You may also wish to create a lid for the electronics housing in some environments.
The Arduino must be programmed by connecting it to a computer with a USB cable and using the free Arduino IDE software (supported on Windows, Mac or Linux). The code we used for controlling the Arduino is supplied along with the other files here, and demonstrates a range of functions. Our code requires two libraries be installed; “AccelStepper” and “Irremote”, both are freely available to download. The libraries should be copied across to your Arduino IDE “Libraries” directory on your computer. See the video guide for detailed instructions on the flashing process, and how to modify the code if your infrared remote is different to the one we used.
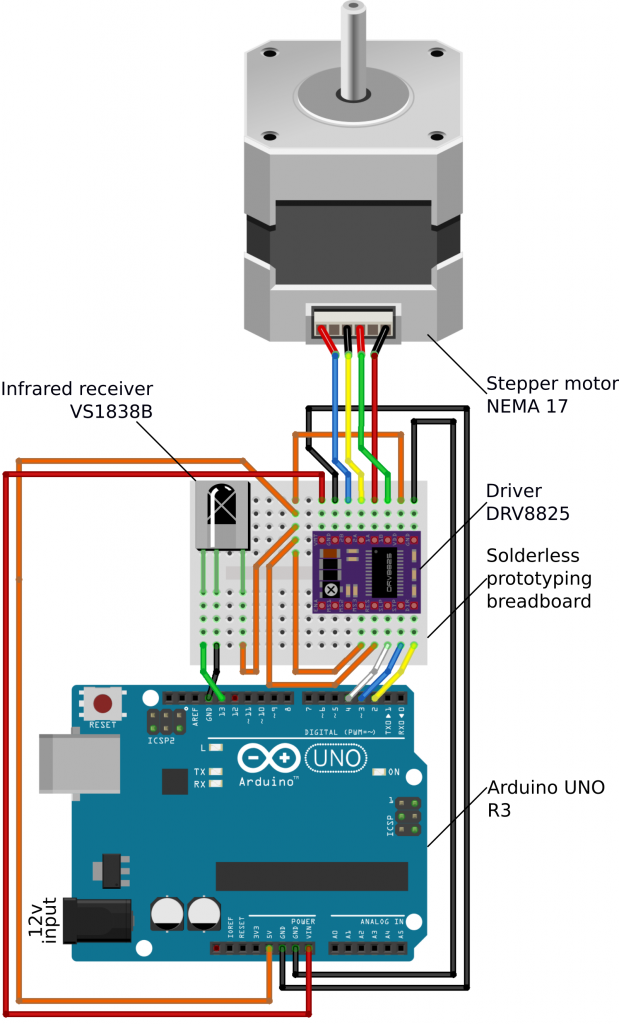
Table 1. List of parts and quantities required for optomotor apparatus assembly. The prices shown may vary depending on supplier, but we were able to source all the parts for approximately £130 in total.
| Description | Product code/description | Quantity | Net cost |
| Arduino + USB cable | UNO R3** | 1 | £10.00 |
| Stepper motor | NEMA 17 Stepper motor, 17HS4401, 200 steps/revolution, 1.7A 40Ncm, 5mm shaft diameter | 1 | £11.00 |
| Stepper motor driver | DRV8825 | 1 | £3.00 |
| Infrared receiver | VS1838B** | 1 | £0.50 |
| Infrared remote | (Elegoo used, but many types will be compatible)** | 1 | £1.00 |
| Aluminium Profile | 2020 T-slot 20×20 approx. 600mm | 2 | £10.00 |
| Sheet material | e.g. expanded PVC or painted plywood. Approx. 5mm thickness, roughly 400x800mm | 1 | £7.00 |
| Diffuser | PTFE 320mm diameter, 0.5mm thick | 1 | £6.00 |
| Drum walls | Card/paper with laser-printed stripes | 4 | £0.20 |
| Light source | Focussed LED lamp (non-flickering) | 1 | £10.00 |
| Camera | Basic 1080p “action camera” | 1 | £30.00 |
| Ball bearing | Inside diam: 10mm, outside diam: 30mm depth:9mm | 1 | £2.50 |
| M3 Bolts | M3 10mm bolt* | 10 | £0.50 |
| M3 Bolts | M3 20mm bolt* | 12 | £0.50 |
| M3 Nuts | M3 nuts* | 22 | £0.50 |
| M5 Bolts | M5 10mm bolt* | 8 | £1.00 |
| T-slot nuts | 2020 M5 T-slot nut* | 8 | £7.00 |
| M10 Bolt | M10 100mm bolt* | 1 | £1.00 |
| M10 lock nut | M10 lock nut* | 1 | £0.25 |
| M10 washers | M10 washers* | 0-5 | £0.25 |
| Power supply | 12v 2 amp (2000mA) power supply with 2.1mm connector | 1 | £10.00 |
| Belt | GT2 6mm belt width, 420 teeth, 840mm | 1 | £5.00 |
| Pulley/sprocket | GT2 6mm, 20 teeth, 5mm bore | 1 | £3.00 |
| Prototyping board | Solderless breadboard, 170 points** | 1 | £1.50 |
| Jumper leads | Various colours recommended** | 17 | £0.50 |
| 3D Printed parts | |||
| Arm hub | Holds arms in place | 1 | £0.30 |
| Motor housing | Housing for stepper motor and electronics boards | 1 | £0.88 |
| Arc section | Curved drum wheel sections | 4 | £1.88 |
| Top bracket | Bracket for holding floor of drum | 1 | £0.60 |
| Arm | Arms/spokes of drum wheel | 4 | £0.80 |
| Pulley | Sprocket/pulley with 80 teeth and bearing hub | 1 | £0.23 |
| Bottom bracket | Bracket securing base of drum | 1 | £0.73 |
| * A2 stainless steel recommended for normal situations, or marine grade for use around salt water. | |||
| ** These parts may be bought substantially cheaper as part of an Arduino kit |
Table 1. List of parts and quantities required for optomotor apparatus assembly. The prices shown may vary depending on supplier, but we were able to source all the parts for approximately £130 in total.
Stimulus construction
The drum is designed to accommodate stimuli made from four sheets of A4 paper, card, or waterproof-paper, although any flexible material could be used. Each sheet requires a small notch to be removed from the bottom corners so that it slots into the channel on each arc section of the wheel (see stimulus template file). Depending on the material you use to create the stimuli, they may be sturdy enough to stand alone. However, if they are not, they can be reinforced at the top using a ring of sturdy material such as cardboard.
To calculate how wide the stripes should be for stimuli of a given spatial frequency, we used the “Cycle width calculation supplement.xlsx” supplemental worksheet.
- 1. First, we filled in the diameter of the stimuli that we were going to use. Based on the size of our experimental arena (300mm diameter), we chose to use stimuli that were 340mm in diameter, so they had sufficient space to rotate freely around the arena. Therefore, we entered “340” into Box B7 of the spreadsheet.
- 2. Next, there are several ways the spreadsheet can calculate stripe widths for stimuli.
- a. First, the spreadsheet can calculate the dimensions of a stimulus when given the desired spatial frequency in cycles per degree. To do so, enter the desired cycles per degree of a given stimulus in Box B21. This will produce the width of each stripe (Box C21) or stripe pair (i.e., cycle; Box D21) for that stimulus.
- b. Second, the spreadsheet can calculate stripe widths for a large number of spatial frequencies. After entering the diameter of your stimuli in Box B7, the yellow table beginning in Line 31 will automatically populate with stimulus dimensions for a large number of spatial frequencies.
- c. Third, the spreadsheet can calculate the spatial frequency (in cpd) of a stimulus (Box D25), given the width of a single stripe (Box B25). This functionality could be used, for example, if someone has previously created optomotor stimuli that you would like to use, but for which you do not know the spatial frequency.
- 3. Because we wanted to create stimuli that ranged in spatial frequency from 1 to 6 cpd, we used the yellow table starting in Line 31 to determine the dimensions of a large number of stimuli. Using the table, we found that we should create stimuli of the following dimensions:
| Spatial frequency (cpd) | Width of single stripe (mm) | Width of stripe pair (cycle; mm) |
| 1 | 1.49 | 2.98 |
| 2 | 0.75 | 1.49 |
| 3 | 0.5 | 0.99 |
| 4 | 0.37 | 0.75 |
| 5 | 0.3 | 0.6 |
| 6 | 0.25 | 0.5 |
- 4. We then created stimuli that comprised vertical black and white stripes of the thicknesses noted in the table above. These should be created as vector graphics (using a vector graphics software such as Adobe Illustrator or the open-source alternative Inkscape; see stimulus template file), and printed with vector rendering. We found, however, that when printing high-frequency stimuli, they exhibited distortions called Moiré patterns (where lines differ in relative size, angle or spacing). These distortions can arise due to the native resolution of the printer. For example, with the stimulus widths in the above table, the highest-frequency stimulus (6 cpd) exhibits Moiré patterns, where line thickness and spacing is uneven (Figure 3):

Therefore, to print stimuli that do not exhibit distortion, we had to account for the native resolution of the printer in choosing the precise stripe widths for the stimuli. To do so, we used the green table in columns G-I in the “Cycle width calculation supplement.xlsx” file. In the blue Box (H13), we entered the native resolution of the printer in dots per inch, which we found in the printer’s technical specifications. The spreadsheet then calculates the size of a single dot (in mm) that the printer can produce. To avoid distortions in the stimuli at high spatial frequencies, we would need to choose stimulus widths that are whole number multiples of the size of a single dot, which the spreadsheet lists in column H, starting at line 17.
For example, the native resolution of our printer is 1200 dots per inch, so we entered “1200” into Box H13. The spreadsheet then calculated that each dot the printer produces is 0.021mm (Box H15). When we tried to print a stimulus at exactly 6cpd (with the width of a single stripe being 0.25mm), distortions in the printed copy arose because 0.25 is not a whole number multiple of 0.021. Using the green table in the spreadsheet, however, we could see that a stimulus of 6.46 cpd can be made using stripe widths that are 0.231mm each. Thus, we could not create stimuli with this printer that are exactly 6cpd, but instead chose a value that was close to 6cpd and which could be printed without any distortions. Note that Moiré distortions tend to only be problematic at high spatial frequencies.
Following the next round of printing, we found no distortions in our stimuli. Thus, the final set of stimuli we printed included 1, 2, 3, 4, 5, and 6.46cpd. We then fashioned the printed stimulus sheets into cylindrical stimuli that could remain upright when placed around the test arena. We also created a “control” stimulus that was made out of plain grey cardstock.
Illumination
It is essential that the drum is well illuminated, and that the illumination from above is entirely consistent, with no shadows or shapes visible or cast onto the roof of the drum which might act as visual cues to the animal inside. We therefore recommend creating a diffuser sheet on top of the drum and using consistent illumination from above. We used a 0.5mm thick sheet of PTFE, cut to a 360mm diameter and attached to a 360mm ring of material such as foamed PVC or cardboard, to keep it flat and sturdy. However, other diffuse materials could be used, such as tissue paper, as long as they are suitably homogeneous in their light transmission. In the centre of the diffuse sheet there must be a circular hole for the video camera to see though.
The drum must be well illuminated, and ideally the light levels should be measured prior to the start of trials (e.g. with a light meter or spectroradiometer) and reported alongside any published results. One of the main requirements of the light source is that it does not flash at a speed that could interfere with the motion of the stripes on the stimuli. LEDs powered via low-voltage circuits are likely to be suitable, as are arc lamps, metal halide lamps, etc. Avoid the use of LEDs powered directly from mains electricity (these are often multiple LEDs wired together in series), because they will flash at the mains AC frequency (50Hz), which is slow enough to potentially cause considerable motion confusion for moving stripes. The presence of flashing can be tested with a high speed camera, capable of 120 frames per second or higher (this is available on many smart phones). Any flashing effects should be readily apparent in the high-speed video footage (see video guide for a demonstration). The light source must cast a uniform illumination onto the diffuser sheet from above, ensuring that any brightness gradients are uniform from the centre to the edges of the circular diffuser sheet.
Recording optomotor trials
The animal’s optomotor response to the drum rotation was recorded using a video camera. This: i) limits experimenter bias (particularly if the experimenter cannot see the animal’s reaction to the drum rotation), ii) acts as a valuable resource for objectively quantifying the animal’s response, and iii) creates a record for archiving and data transparency. The camera itself must be positioned in the centre of the diffuser sheet, however it would create a shadow of its outline. We therefore recommend making an opaque circular disk with a central hole just large enough for the lens to see through, and an external diameter large enough to completely block the camera’s shadow from reaching the diffuser. The animal looking up from the base of the drum will therefore only be able to see a circular shadow in the centre of the roof, with a circular lens looking through, offering no rotational movement cues.
Preliminary experiments: choosing experimental parameters
From the literature and Table 2 provided here, we found published drum rotation speeds in fish similar in size to our species of interest ranged from 1 to 15 rpm. However, preliminary experiments with our fish showed that they exhibit a robust optomotor response to a stimulus of 1cpd (our lowest-frequency stimulus) when presented at 1 rotation per minute. Thus, based on the recommendation that one should select the lowest rotation speed that elicits a reliable response, we chose to rotate the drum at 1rpm.
Preliminary experiments at 1 rpm and using various stimuli showed that individuals often took up to 30 seconds to respond to stimulus rotation; therefore, we programmed the apparatus to rotate for 45 seconds in each direction, which gave the fish sufficient time to respond to the stimulus after accounting for response latency. Additionally, these preliminary experiments allowed us to determine which optomotor response behaviours are robust and reliable in this species. For example, we found that individuals generally exhibit robust tracking responses in one direction, but weren’t very adept at changing direction and also generally continued to rotate for approximately 3-5 seconds after the stimulus stopped rotating.
To account for this, we decided to present each stimulus a total of four times: two clockwise rotations and two counter-clockwise rotations, and to define a positive optomotor response as at least one-half rotation or pivot of the whole body in the direction of drum rotation in at least two of the four trials for a given stimulus.
Collecting data
For each fish, we used the function Sample in the open-source R platform (R Development Core Team, 2019) to generate a random order in which to present the stimuli. This ensured that stimuli were not consistently presented from thicker to thinner stripes or vice versa. All trials were video recorded.
Data Analysis
Here, as a representative example, we display data for one fish from our experiment and discuss data analysis.
First, two viewers annotated all of the videos. By using a paper screen with a “viewing porthole” that showed only the fish, but not the rotating stimuli, we ensured that the viewers were blind to both the direction of stimulus rotation as well as to the stimulus identity. Based on Brokovich et al. (2010), Dobberfuhl, Ullmann, & Shumway (2005), and our own preliminary annotation of videos, we defined a positive response as at least one-half rotation by swimming or pivoting in the direction of drum rotation and at roughly the speed of stimulus rotation. Each fish was given four trials with each stimulus, and we considered that a fish had responded to that stimulus if it displayed positive responses in at least three out of four trials. Therefore, when annotating the videos, viewers noted whether or not the fish achieved at least ½ rotation in either the clockwise or counter-clockwise direction (see table 3 below). See Supplemental Video 2 for an example of a positive response at 0.4 cycles per degree, and Supplemental Video 3 for an example of a negative response at 4 cycles per degree. After annotating all of the videos, the annotations from the two viewers were compared; agreement between the two viewers was 90%, so the annotations from the viewer with more experience viewing optomotor footage was used for analysis.
| Trial Number | Rotation Direction | Stimulus Frequency | Positive Response? |
| 1 | CL | 0.2 | 1 |
| 2 | CO | 0.2 | 1 |
| 3 | CL | 0.2 | 1 |
| 4 | CO | 0.2 | 1 |
| 1 | CL | 0.4 | 1 |
| 2 | CO | 0.4 | 1 |
| 3 | CL | 0.4 | 1 |
| 4 | CO | 0.4 | 1 |
| 1 | CL | 0.6 | 1 |
| 2 | CO | 0.6 | 1 |
| 3 | CL | 0.6 | 1 |
| 4 | CO | 0.6 | 0 |
| 1 | CL | 0.8 | 1 |
| 2 | CO | 0.8 | 1 |
| 3 | CL | 0.8 | 0 |
| 4 | CO | 0.8 | 1 |
| 1 | CL | 1 | 0 |
| 2 | CO | 1 | 1 |
| 3 | CL | 1 | 1 |
| 4 | CO | 1 | 1 |
| 1 | CL | 2 | 1 |
| 2 | CO | 2 | 1 |
| 3 | CL | 2 | 0 |
| 4 | CO | 2 | 1 |
| 1 | CL | 3 | 1 |
| 2 | CO | 3 | 1 |
| 3 | CL | 3 | 0 |
| 4 | CO | 3 | 1 |
| 1 | CL | 4 | 0 |
| 2 | CO | 4 | 1 |
| 3 | CL | 4 | 0 |
| 4 | CO | 4 | 1 |
| 1 | CL | 5 | 0 |
| 2 | CO | 5 | 0 |
| 3 | CL | 5 | 1 |
| 4 | CO | 5 | 0 |
| 1 | CL | 6 | 0 |
| 2 | CO | 6 | 0 |
| 3 | CL | 6 | 0 |
| 4 | CO | 6 | 0 |
| 1 | CL | control | 0 |
| 2 | CO | control | 0 |
| 3 | CL | control | 0 |
| 4 | CO | control | 0 |
Table 3: Representative data for optomotor responses from a single individual, with four trials per stimulus. Rotation direction was either clockwise (“CL”) or counter-clockwise (“CO”). Stimuli ranged between 0.2 and 6 cycles per degree. Positive response (1= yes, 0=no) was defined as in the text above.
We then plotted the number of trials in which a fish performed at least a half-turn for each stimulus (Figure 4). From the figure, it can be seen that the criteria for a positive response were met at 0.2, 0.4, 0.6, 0.8, 1, 2, and 3 cycles per degree. However, the responses fell below the criteria for a positive response at 4, 5, and 6 cycles per degree. In no trials did the fish display at least a half-rotation to the control stimulus. Therefore, based on these data, we conclude that the acuity of this fish is between 3 and 4 cycles per degree (0.25 degrees minimum resolvable angle).
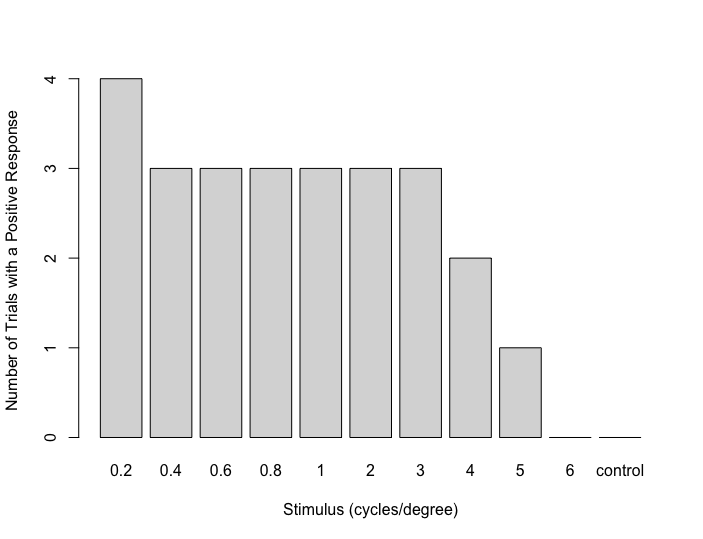
Figure 4. Number of trials (out of four per stimulus) in which this fish performed at least one-half rotation in the direction of stimulus motion for each stimulus.
Although similar data are not available for this species from any other studies, this value does align well with predictions based on the size of the fish, which has been previously shown to be a very strong predictor of acuity across ray-finned fish (Caves et al., 2017). In particular, based on the fish’s body size (3.27cm), we would predict that its acuity is 3.48cpd, which is consistent with the values we recorded using the optomotor apparatus.
| Class | Genus | Species | Common name | Drum Speed (rpm) | Stimulus Diameter (cm) | Internal Cylinder Diameter (cm) | Animal restrained? | Light Adaptation Time (min) | Source |
| Actinopterygii | Danio | rerio | Zebrafish | 02/05/20 | 39 | Yes | (Tappeiner et al., 2012) | ||
| Actinopterygii | Dascyllus | marginatus | Damselfish | 2.25 | 41 | 20 | No | 20 | (Brokovich et al., 2010) |
| Actinopterygii | Enantiopus | melanogenys | Cichlid | 4 | 28 | 24.5 | No | 10 | (Dobberfuhl et al., 2005) |
| Actinopterygii | Forsterygion | varium | Variable triplefin (larvae) | 0-8 | 6 or 12 | 2 | No | (Pankhurst, Pankhurst, & Montgomery, 1993) | |
| Actinopterygii | Oncorhynchus | mykiss | Rainbow trout (larvae) | 8 | 6 or 12 | 2 | No | 1 | (Rahmann, Jeserich, & Zeutzius, 1979) |
| Actinopterygii | Oryzias | latipes | Medaka | 4 | 48 | 0.6-9 | No | (Carvalho, Noltie, & Tillitt, 2002) | |
| Actinopterygii | Pleuronectes | platessa | Plaice (larvae) | 2-15 | 9.5 or 15.5 | 2 | No | (Neave, 1984) | |
| Actinopterygii | Xenotilapia | flavipinnis | Yellow sand cichlid | 4 | 28 | 24.5 | No | 10 | (Dobberfuhl et al., 2005) |
| Actinopterygii | Xenotilapia | leptura | Cichlid | 4 | 28 | 24.5 | No | 10 | (Dobberfuhl et al., 2005) |
| Actinopterygii | Xenotilapia | spilopterus | Cichlid | 4 | 28 | 24.5 | No | 10 | (Dobberfuhl et al., 2005) |
| Amphibia | Rana | temporaria | Common frog | 6 | 44 | (Birukow, 1937) | |||
| Amphibia | Triturus | cristatus | Crested newt | 1 | 74, 58, 48, or 20 | No | (Manteuffel & Himstedt, 1978) | ||
| Aves | Calypte | anna | Anna’s hummingbird | 1 | 100 | Yes | 2 | (Goller et al., 2019) | |
| Aves | Gallus | gallus | Domestic Chicken (chick) | 1 | 50 | Yes | (Schmid & Wildsoet, 1998) | ||
| Branchiopoda | Daphnia | pulex | Water flea | 1.22-4 | 24 | 4 | No | 02/04/20 | (Hathaway & Dudycha, 2018) |
| Cephalopoda | Nautilus | pompilius | Nautilus | 4 | 50 | 25 | No | (Muntz & Raj, 1984) | |
| Cephalopoda | Octopus | vulgaris | Common octopus | 1 | 30 or 60 | 7.5 | No | (Packard, 1969) | |
| Cephalopoda | Sepia | officinalis | Common cuttlefish | 3 | 152 | 23 | No | 1 | (Groeger, Cotton, & Williamson, 2005) |
| Insecta | Apis | mellifera | Honeybee | 5 | 15.5 | Yes | (Moore, Penikas, & Rankin, 1981) | ||
| Insecta | Hypothenemus | hampei | Coffee Berry Borer | 13 | 31 | No | (Vega et al., 2014) | ||
| Insecta | Xenos | peckii | Twisted-wing insect | 16 | Yes | (Maksimovic, Layne, & Buschbeck, 2007) | |||
| Malacostraca | Alpheus | heterochaelis | Snapping shrimp | 30 | 7.5 | No | (Kingston, Lucia, Havens, Cronin, & Speiser, 2019) | ||
| Malacostraca | Ancylomenes | pedersoni | Pederson shrimp | 6 | 56 | 8 | No | 15 | (Caves, Frank, & Johnsen, 2016) |
| Malacostraca | Callinectes | sapidus | Blue crab | 2 | 56 | 30 | No | 15 | (Baldwin & Johnsen, 2011) |
| Malacostraca | Lysmata | amboinensis | Scarlet cleaner shrimp | 6 | 56 | 8 | No | 15 | (Caves et al., 2016) |
| Malacostraca | Pachygrapsus | crassipes | Striped shore crab | 0.5 | 48 | Yes | (Wiersma & Hirsh, 1974) | ||
| Malacostraca | Panulirus | interruptus | rock lobster | 0.5 | 48 | Yes | (Wiersma & Hirsh, 1974) | ||
| Malacostraca | Procambarus | clarkii | Crayfish | 0.5 | 48 | Yes | (Wiersma & Hirsh, 1974) | ||
| Malacostraca | Urocaridella | antonbrunii | Clear cleaner shrimp | 6 | 56 | 8 | No | 15 | (Caves et al., 2016) |
| Mammalia | Anoura | geoffroyi | Geoffroy’s tailless bat | 6 | 40 | 12 | No | (Suthers, 1966) | |
| Mammalia | Antrozous | pallidus | Pallid bat | 01/05/20 | 38 | 12 | No | 30 | (Bell & Fenton, 1986) |
| Mammalia | Artibeus | jamaicensis | Jamaican fruit bat | 6 | 40 | 12 | No | (Suthers, 1966) | |
| Mammalia | Carollia | perspicillata | Seba’s short-tailed bat | 6 | 40 | 12 | No | (Suthers, 1966) | |
| Mammalia | Desmodus | rotundus | Common vampire bat | 6 | 40 | 12 | No | (Suthers, 1966) | |
| Mammalia | Diaemus | youngi | White-winged vampire bat | 6 | 40 | 12 | No | (Suthers, 1966) | |
| Mammalia | Eptesicus | fuscus | Big brown bat | 01/05/20 | 38 | 12 | No | 30 | (Bell & Fenton, 1986) |
| Mammalia | Macrotus | californicus | California leaf-nosed bat | 01/05/20 | 38 | 12 | No | 30 | (Bell & Fenton, 1986) |
| Mammalia | Monodelphis | domestica | Short-tailed opossum | 2.4 | 56 | 15 | No | (Dooley, Nguyen, Seelke, & Krubitzer, 2012) | |
| Mammalia | Mus | musculus (lab) | Lab mouse | 2 | 29 | 11.5 (platform) | No | 10 (scotopic1); 5 (photopic2) | (Abdeljalil et al., 2005) |
| Mammalia | Mus | musculus (lab) | lab mouse | 2 | 30 | 8 | No | 0.5 | (Thaung, Arnold, Jackson, & Coffey, 2002). |
| Mammalia | Myotis | lucifugus | Little brown bat | 6 | 40 | 12 | No | (Suthers, 1966) | |
| Mammalia | Oryctolagus | cuniculus | Rabbit | 01/03/20 | 63.5 | 50 (platform) | Yes | (Hahnenberger, 1977) | |
| Mammalia | Peromyscus | leucopus | White-footed mouse | 2.5-6 | 20, 40, or 80 | 12.5 (platform) | Yes | 2 | (Vestal, 1973) |
| Mammalia | Peromyscus | maniculatus | Deer mouse | 2.5-6 | 20, 40, or 80 | 12.5 (platform) | Yes | 2 | (Vestal, 1973) |
| Mammalia | Phyllostomus | hastatus | Greater spear-nosed bat | 6 | 40 | 12 | No | (Suthers, 1966) | |
| Mammalia | Rattus | norvegicus | Rat | 2 | 58 | 22 (platform) | No | 0.5 | (Cowey & Franzini, 1979) |
| Mammalia | Rattus | norvegicus | Rat | 2 | 48 | No | (Douglas et al., 2005) | ||
| Mammalia | Saccopteryx | bilineata | Greater sac-winged bat | 6 | 40 | 12 | No | (Suthers, 1966) | |
| Mammalia | Saccopteryx | leptura | Lesser sac-winged bat | 6 | 40 | 12 | No | (Suthers, 1966) | |
| Reptilia | Chamaeleo | chamaeleon | Common chameleon | 1 | 136 or 93 | 18 | Yes for OKR3; no for OMR4 | 0.5 | (Lev-Ari, Katz, Lustig, & Katzir, 2017) |
| Reptilia | Chelonia | mydas | Green turtle (hatchlings) | 10 | 38 | 19 | No | 5 | (Ireland, 1979) |
| Reptilia | Pseudemys | scripta | red-eared turtle | 20 | 30 | Yes | 10 | (Hayes & Ireland, 1972) | |
| Reptilia | Ptyodactylus | hasselquistii | Fan-footed gecko | 2-11.5 | 50 | 20 | No | 15 | (Frankenberg, 1981) |
| Reptilia | Sphenodon | punctatus | Tuatara | 4 | 102.5 | 50.8 | No | 5 | (Ireland & Gans, 1977) |
Table 2. Experimental parameters in selected, published optomotor experiments. Drum speed (rpm) is the rotation speed of the stimulus drum. Stimulus diameter (cm) indicates the diameter of the drum upon which stimuli are displayed. Internal cylinder diameter indicates the dimensions of a smaller internal cylinder (if used) to restrict the animal’s movements; in some cases, this was a platform of certain dimensions upon which the animal was placed. “Animal restrained” indicates whether the animal was physically restrained such that it could or could not move about during experiments. Light adaptation time, if indicated in the original publication, is listed in minutes.
1Photopic = daylight light conditions mediated by cone vision;
2scotopic = twilight or nocturnal light conditions mediated by rod vision.
3OKR = optokinetic response (only the eyes moving in response to a stimulus);
4OMR = optomotor response (whole body movement in response to a stimulus).
Literature Cited
- Abdeljalil, J., Hamid, M., Abdel-Mouttalib, O., Stéphane, R., Raymond, R., Johan, A., … Serge, P. (2005). The optomotor response: A robust first-line visual screening method for mice. Vision Research, 45(11), 1439–1446. doi:10.1016/j.visres.2004.12.015
- Baldwin, J., & Johnsen, S. (2011). Effects of molting on the visual acuity of the blue crab, Callinectes sapidus. The Journal of Experimental Biology, 214(Pt 18), 3055–61. doi:10.1242/jeb.056861
- Bell, G. P., & Fenton, M. B. (1986). Visual acuity, sensitivity and binocularity in a gleaning insectivorous bat, Macrotus californicus (Chiroptera: Phyllostomidae). Animal Behaviour, 34(2), 409–414. doi:10.1016/S0003-3472(86)80110-5
- Birukow, G. (1937). Untersuchungen über den optischen Drehnystagmus und über die Sehschärfe des Grasfrosches (Rana temporaria). Journal of Comparative Physiology A: Neuroethology, Sensory, Neural, and Behavioral Physiology, 25(1), 92–142.
- Brokovich, E., Ben-Ari, T., Kark, S., Kiflawi, M., Dishon, G., Iluz, D., & Shashar, N. (2010). Functional changes of the visual system of the damselfish Dascyllus marginatus along its bathymetric range. Physiology and Behavior, 101(4), 413–421. doi:10.1016/j.physbeh.2010.07.006
- Carvalho, P. S. ., Noltie, D. B., & Tillitt, D. E. (2002). Ontogenetic improvement of visual function in the medaka Oryzias latipes based on an optomotor testing system for larval and adult fish. Animal Behaviour, 64(1), 1–10. doi:10.1006/anbe.2002.3028
- Caves, E. M., Frank, T. M., & Johnsen, S. (2016). Spectral sensitivity, spatial resolution, and temporal resolution and their implications for conspecific signalling in cleaner shrimp. Journal of Experimental Biology, 219, 597–608.
- Caves, E. M., Sutton, T. T., & Johnsen, S. (2017). Visual acuity in ray-finned fishes correlates with eye size and habitat. The Journal of Experimental Biology, (220), 1586–1596. doi:10.1242/jeb.151183
- Cowey, A., & Franzini, C. (1979). The retinal origin of uncrossed optic nerve fibres in rats and their role in visual discrimination. Experimental Brain Research, 35(3), 443–455. doi:10.1007/BF00236763
- Dobberfuhl, A. P., Ullmann, J. F. P., & Shumway, C. A. (2005). Visual acuity, environmental complexity, and social organization in African cichlid fishes. Behavioral Neuroscience, 119(6), 1648–1655. doi:10.1037/0735-7044.119.6.1648
- Dooley, J. C., Nguyen, H. M., Seelke, A. M. H., & Krubitzer, L. (2012). Visual acuity in the short-tailed opossum (Monodelphis domestica). Neuroscience, 223, 124–130. doi:10.1016/j.neuroscience.2012.07.065
- Douglas, R. M., Alam, N. M., Silver, B. D., Mcgill, T. J., Tschetter, W. W., & Prusky, G. T. (2005). Independent visual threshold measurements in the two eyes of freely moving rats and mice using a virtual-reality optokinetic system. Visual Neuroscience, 22(5), 677–684. doi:10.1017/S0952523805225166
- Frankenberg, E. (1981). Optomotor responses of three congeneric gekkonid lizards having different daily activity times. Journal of Zoology, 193(2), 147–156. doi:10.1111/j.1469-7998.1981.tb03435.x
- Goller, B., Fellows, T. K., Dakin, R., Tyrrell, L., Fernández-Juricic, E., & Altshuler, D. L. (2019). Spatial and temporal resolution of the visual system of the Anna’s hummingbird (Calypte anna) relative to other birds. Physiological and Biochemical Zoology : PBZ, 92(5), 481–495. doi:10.1086/705124
- Groeger, G., Cotton, P. A., & Williamson, R. (2005). Ontogenetic changes in the visual acuity of Sepia officinalis measured using the optomotor response. Canadian Journal of Zoology, 83(2), 274–279. doi:10.1139/z05-011
- Hahnenberger, R. W. (1977). Differences in optokinetic nystagmus between albino and pigmented rabbits. Experimental Eye Research, 25(1), 9–17. doi:10.1016/0014-4835(77)90240-8
- Hathaway, C. R., & Dudycha, J. L. (2018). Quantitative measurement of the optomotor response in free-swimming Daphnia. Journal of Plankton Research, 40(3), 222–229. doi:10.1093/plankt/fby014
- Hayes, W. N., & Ireland, L. C. (1972). A study of visual orientation mechanisms in turtles and guinea pigs. Brain, Behavior and Evolution, 5(2–3), 226–239. doi:10.1159/000123749
- Ireland. (1979). Optokinetic behavior of the hatchling green turtle (Chelonia mydas) soon after leaving the nest. Herpetologica, 35(4), 365–370.
- Ireland, L. C., & Gans, C. (1977). Optokinetic behavior of the Tuatara, Sphenodon punctatus. Herpetologica, 33(3), 339–344.
- Kingston, A. C. N., Lucia, R. L., Havens, L. T., Cronin, T. W., & Speiser, D. I. (2019). Vision in the snapping shrimp Alpheus heterochaelis. Journal of Experimental Biology, 222(21), 1–8. doi:10.1242/jeb.209015
- Lev-Ari, T., Katz, H. K., Lustig, A., & Katzir, G. (2017). Visual acuity and optokinetic directionality in the common chameleon (Chamaeleo chamaeleon). EC Opthalmology, 6.5, 145–154.
- Maksimovic, S., Layne, J. E., & Buschbeck, E. K. (2007). Behavioral evidence for within-eyelet resolution in twisted-winged insects (Strepsiptera). The Journal of Experimental Biology, 210(Pt 16), 2819–2828. doi:10.1242/jeb.004697
- Manteuffel, G., & Himstedt, W. (1978). The aerial and aquatic visual acuity of the optomotor response in the crested newt (Triturus cristatus). Journal of Comparative Physiology A, 128(4), 359–365. doi:10.1007/BF00657609
- Moore, D., Penikas, J., & Rankin, M. A. (1981). Regional specialization for an optomotor response in the honeybee compound eye. Physiological Entomology, 6(1), 61–69. doi:10.1111/j.1365-3032.1981.tb00261.x
- Muntz, B. Y. W. R. A., & Raj, U. (1984). On the Visual System of Nautilus pompilius. Journal of Experimental Biology, 109(1), 253–263.
- Neave, D. A. (1984). The development of visual acuity in larval plaice (Pleuronectes platessa L.) and turbot (Scophthalmus maximus L.). J. Exp. Mar. Biol. Ecol., 78, 167–175. doi:10.1016/0022-0981(84)90077-7
- Packard, A. (1969). Visual acuity and eye growth in Octopus vulgaris (lamarck). Monitore Zoologico Italiano – Italian Journal of Zoology, 3(1), 19–32. doi:10.1080/00269786.1967.10736132
- Pankhurst, P. M., Pankhurst, N. W., & Montgomery, J. C. (1993). Comparison of behavioural and morphological measures of visual acuity during ontogeny in a teleost fish, Forsterygion. Brain, Behavior and Evolution, 42, 178–188.
- R Development Core Team. (2019). R: a language and environment for statistical computing. R Foundation for Statistical Computing, Vienna, Austria. URL https://www.R-project.org/.
- Rahmann, H., Jeserich, G., & Zeutzius, I. (1979). Ontogeny of visual acuity of rainbow trout under normal conditions and light deprivation. Behaviour, 68, 315–322.
- Schmid, K. L., & Wildsoet, C. F. (1998). Assessment of visual acuity and contrast sensitivity in the chick using an optokinetic nystagmus paradigm. Vision Research, 38(17), 2629–2634. doi:10.1016/S0042-6989(97)00446-X
- Suthers, R. (1966). Optomotor responses by echolocating bats. Science, 152, 1102–1104.
- Tappeiner, C., Gerber, S., Enzmann, V., Balmer, J., Jazwinska, A., & Tschopp, M. (2012). Visual acuity and contrast sensitivity of adult zebrafish. Frontiers in Zoology, 9, 10. doi:10.1186/1742-9994-9-10
- Thaung, C., Arnold, K., Jackson, I. J., & Coffey, P. J. (2002). Presence of visual head tracking differentiates normal sighted from retinal degenerate mice. Neuroscience Letters, 325(1), 21–24. doi:10.1016/S0304-3940(02)00223-9
- Vega, F. E., Simpkins, A., Bauchan, G., Infante, F., Kramer, M., & Land, M. F. (2014). On the eyes of male coffee berry borers as rudimentary organs. PLoS ONE, 9(1), 1–7. doi:10.1371/journal.pone.0085860
- Vestal, B. M. (1973). Ontogeny of visual acuity in two species of deermice (Peromyscus). Animal Behaviour, 21, 711–719.
- Wiersma, C. A. G., & Hirsh, R. (1974). Memory evoked optomotor responses in crustaceans. Journal of Neurobiology, 5(3), 213–230.