
by Michal Šulc:
Colouration plays a crucial role in the life of animals. On one hand, animals distinguish between colours, which gives them important information about their environment and enables them, e.g., to find food or a suitable mate. On the other hand, their colouration can signal individuals of the same or different species, allowing them, for instance, to display their qualities or avoid predation. Therefore, animal colouration is under constant selection pressure and has always attracted the scientific community’s attention. To obtain objective information on colours and patterns (e.g. speckles of bird eggs), the micaToolbox is the most widely used tool that analyses digital photographs and simulates how animals see the world.
“It is necessary that photography should return to its real task, which is to serve science and art… let it decorate the naturalist’s study, magnify microscopic animals, and perhaps confirm the astronomer’s hypotheses with some data; let it be a helper, a kind of notebook for everyone who needs absolute accuracy in his profession; it is well suited for this purpose.”
— Baudelaire (1821–1867)
“To love animals means to know them.“
— Zdeněk Veselovský (1928–2006)
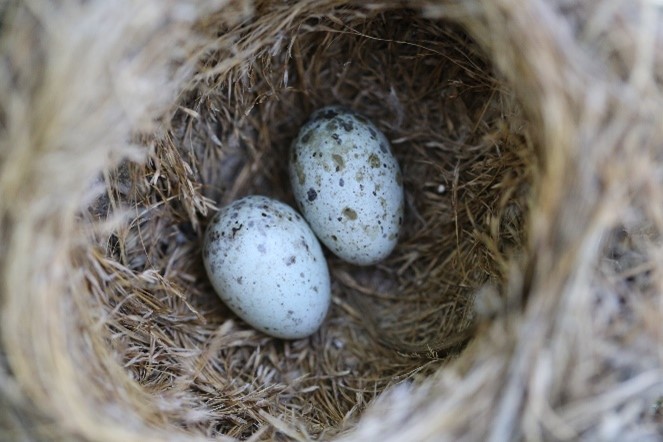
When I started to investigate the brood parasitism of the common cuckoo (Cuculus canorus) at Mutěnice and Hodonín ponds (Czech Republic) in 2010, I was mainly concerned with the striking similarity between cuckoo eggs and the eggs of their hosts. This phenomenon is called mimicry (Fig. 1). The founder and head of research on brood parasitism at the Institute of Vertebrate Biology of the Czech Academy of Sciences, Marcel Honza, used a particular, widely used method of measuring egg colouration – spectrometry.
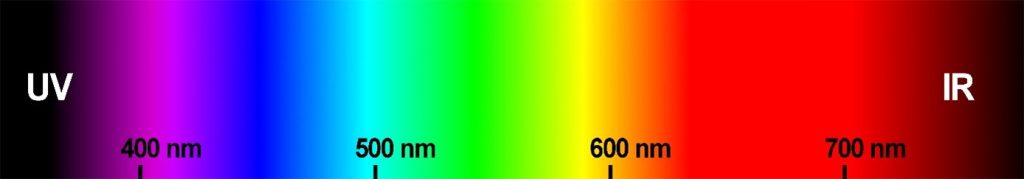
A spectrometer is an instrument that measures the spectrum of electromagnetic radiation, e.g., light perceived by human eyesight (radiation with a wavelength of 400–700 nm), but also radiation imperceptible to the human eye, e.g., ultraviolet (UV) or infrared (IR). One of the possible uses of this instrument is to measure reflectance, i.e., radiation that is reflected from objects. And thanks to the different wavelength compositions that this reflected radiation contains (Fig. 2), most animal species can distinguish the colours of objects. Compared to subjective human colour assessment, spectrometry has the advantage that the colour data obtained is objective. In addition, the spectrometer can also measure radiation that we humans are unable to perceive, but other species can. Without this information, we would never know, for example, how the daily life of birds or insects is affected by their ability to perceive UV radiation (Bennett and Cuthill 1994; Van Der Kooi et al. 2021).
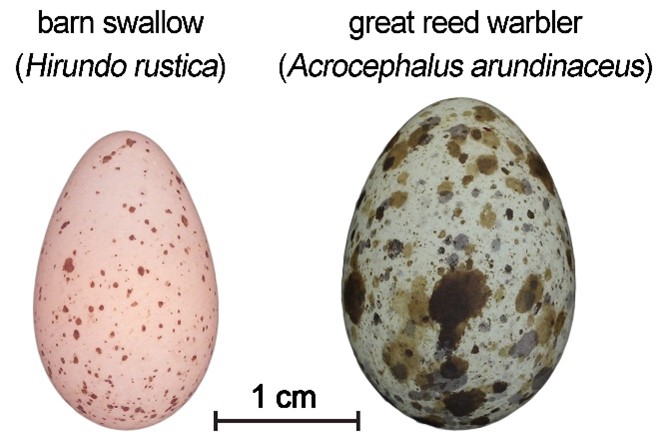
However, there are several disadvantages to using a spectrometer. Apart from the high purchase price and the invasiveness of its use (the measurement usually requires touching the object and pinning it down), a significant problem is that the spectrometer measures the colour of only a tiny area of the object (about 1 mm2). This may not be a problem when measuring objects whose colouration is constant and easy to define, such as the beige background colour of the eggs of the barn swallow (Hirundo rustica, Fig. 3). However, a complication arises when measuring objects with complex colouration, such as the eggs of the great reed warbler (Acrocephalus arundinaceus, Fig. 3). Therefore, a spectrometer is not suitable for assessing intricate colour patterns.
A camera is an ideal tool for colour and pattern research
An “ordinary” camera can be perfectly suitable for studying colours and patterns in nature. The invention of this device, which almost everyone now owns, dates back more than 200 years. Its inventor is believed to be Joseph Nicéphore Niépce, who took the earliest surviving photograph of the view from a window at Le Gras in 1826. Since then, scientists have had plenty of time to become familiar with this invention and use it for various purposes. Photography thus found its use in presenting all sorts of scientific discoveries. For example, the journal Nature began publishing scientific photographs on its pages as early as the 1890s (Wilder 2009). We owe photography phenomenal discoveries that we could hardly have made without it. Examples include the 1886 photographs of Saturn and Jupiter by the Henry brothers or the photograph 51 (the official title of this famous image) taken by Raymond Gosling in 1952, which led to the discovery of the structure of DNA.
As you can see, photography can even show objects invisible to the human eye. Photography has recently undergone a minor renaissance in biology as it has found widespread use in studying the ecology and evolution of colouration in animals and plants. Like the spectrometer, cameras are instruments that can capture the colour of objects objectively, for example (after slight modification), even in the UV and IR part of the spectrum. Unlike a spectrometer, the great advantage of cameras is their ability to capture the colour information of a larger area of investigation. In this respect, photography is not limited by the object’s size; microscopes can be used to photograph miniature bacteria, while drones, aircraft or satellites can obtain photographs of landscapes, continents, or stars.
A significant advance for the use of photography in biology comes from new knowledge about the visual system of various species, often very different from our human one. Thanks to this information, we can “translate” the information obtained about colour and pattern into the visual system of the studied species. The reader can see how fascinating this topic is in David Attenborough’s new show ‘Life in Colour’ or the accompanying book by Prof. Martin Stevens, ‘Life in Colour – How Animals See the World’.
The MICA Toolbox
In 2018, thanks to a mobility grant from the Czech Academy of Sciences, I had the opportunity to visit the University of Exeter in Penryn, Cornwall, England. There I met Prof. Martin Stevens and Dr Jolyon Troscianko. Both are leading scientists in sensory ecology, a relatively new field investigating how animals acquire and use information about their environment. Some of the phenomena researched by them include camouflage, aposematism and mimicry. Prof. Stevens and Dr Troscianko are famous for creating the micaToolbox tool (after the acronym of the words multispectral image calibration and analysis), which allows for the analysis of colouration and patterns from captured photographs in a user-friendly environment, specifically from the perspective of the animal species being studied (Troscianko and Stevens 2015).
The MicaToolbox is not a stand-alone program but a plugin that runs within ImageJ (Schneider et al., 2012). ImageJ is a platform developed by the National Institutes of Health in the USA, used initially to analyse medical images. However, the purpose of ImageJ has expanded dramatically due to the ability to write custom scripts. It is now used for image analysis by many users, including biologists. ImageJ and micaToolbox are freely downloadable at www.empiricalimaging.com. The user can also find detailed installation instructions and video tutorials on using the tool.
Many exciting discoveries have already been made with the micaToolbox. Recent ones include the discovery that nocturnal butterflies in environments with artificial lighting have a reduced ability to find and forage for plant flowers (Briolat et al., 2021) or that the striking black and white colouration of the giant panda (Ailuropoda melanoleuca) and the tail feathers of the crowned peacock (Pavo cristatus) appear cryptic to their predators (Kane et al. 2019; Nokelainen et al., 2021). Or researchers at the Institute of Vertebrate Biology in the Czech Republic have found that we can identify the female bird who laid a given egg based on the egg’s visual appearance (Šulc et al., 2021).
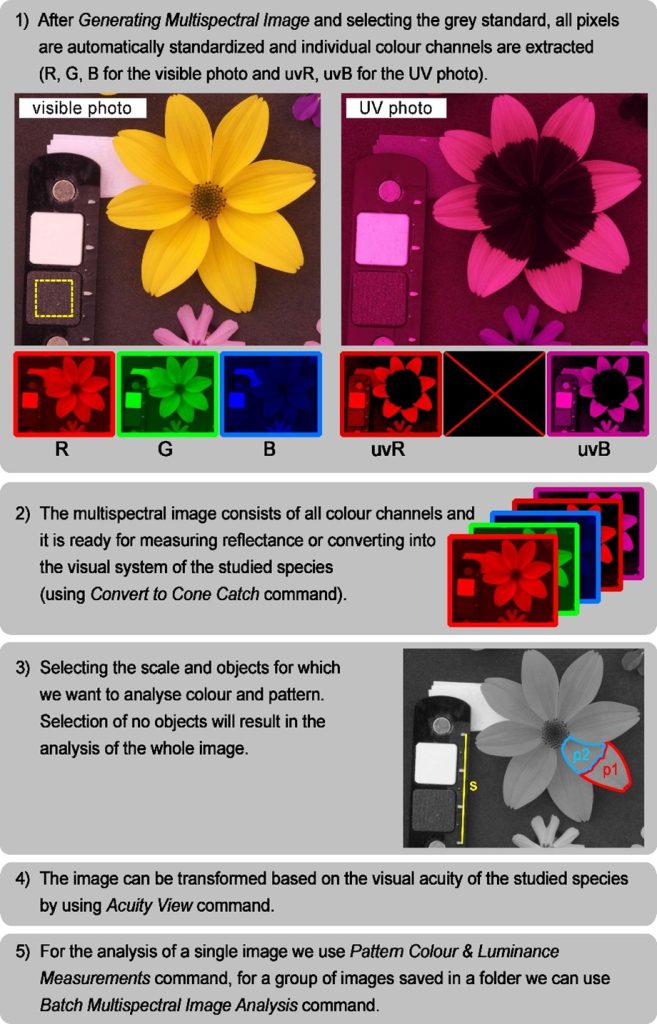
The MicaToolbox lets us obtain considerable information about objects and backgrounds in photos. The toolbox provides almost 200 parameters, particularly with the addition of the ‘quantitative colour pattern analysis’ framework in (QCPA) (van den Berg & Troscianko et al., 2020). Constrained not only by space but admittedly incomplete knowledge of all of these (often novel) parameters, I will describe two specific, very valuable analyses – the assessment of colour and pattern similarity (briefly summarised workflow in Fig. 4).
These analyses (Troscianko & Stevens, 2015) are based on our knowledge of animal colour and pattern perception, particularly cone sensitivity and visual acuity. This is especially important when we consider that, unlike humans, many animal species are also able to perceive UV light (Cronin and Bok, 2016) or that the visual acuity of most species is so much worse than human visual acuity that we would consider people with such visual acuity legally blind (Caves et al., 2018).
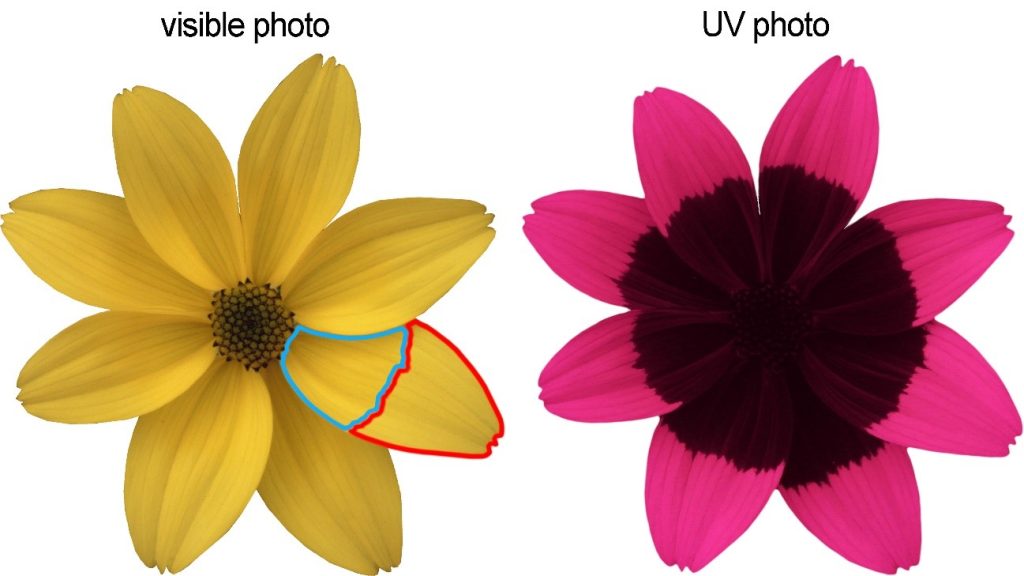
To demonstrate the striking difference in colour perception between humans and other animal species, I chose the petals of the sunflower Jerusalem artichoke (Helianthus tuberosus) as my object and the honeybee (Apis mellifera) as my study species. Since bees can also perceive UV radiation, I took two photographs of the Jerusalem artichoke flower with the same composition (Fig. 5). One capturing only visible light (400–700 nm) and the other capturing only UV radiation (335–400 nm). Older cameras (e.g., the Samsung NX1000 used here) are suitable for capturing UV photographs, as they allow (after slight modification) UV light to reach the sensor. Information on how to modify such a camera and take a UV photo correctly can be found on the website (www.empiricalimaging.com). To compare the two egg patterns, I took photographs of two swallow eggs laid by two different females. But let’s start at the beginning, with the necessary equipment and taking a good quality picture.
Camera and other necessary equipment
To begin with, it should be stressed that the accuracy of the analysis depends significantly on the quality of a photograph. However, this does not mean we cannot use cheaper camera models or even the camera in a mobile phone. The most important thing is to use lenses with minimal optical error (e.g. vignetting or radial aberration) and a fixed focal length (i.e. without zoom). It is also ideal to use a camera capable of taking RAW files. RAW photographs contain data directly from the sensor that the camera has not modified. As a result, these photos contain linear information about the subject, meaning that if the subject reflects twice as much light as another subject, this ratio is maintained in the resulting RAW image.
Other (non-RAW) format types, such as JPEG, are images primarily intended to please the human eye and are post-processed by the camera. However, this also means that they no longer correspond to the actual colour of the objects photographed (they are non-linear). These can also be used for accurate colour and pattern analysis. Still, they need to be linearised using a function that detects how the camera has modified the image and undoes these modifications. The micaToolbox provides this functionality (‘Model Linearisation Function’) which is not difficult to perform (even retrospectively, after all the images have been taken).
Another essential piece of equipment is a grey standard of known reflectance, which must be present in every photograph (Fig. 4). This standardises all the pixels in a picture and allows us to measure their reflectance objectively and to compare photos with each other, even though they were taken under different lighting conditions (for example, under clear or cloudy skies). Finally, suppose we also want to evaluate the pattern (spots, stripes etc.). In that case, it is necessary to have a scale on the photograph (Fig. 4). With it, we will be able to check all the pictures taken for variations caused by photographing objects from different distances, but also to measure various spatial parameters of the pattern (e.g., size of spots, the width of stripes, etc.) or to adjust the image according to the visual acuity of the species under study (see below).
Camera and scene settings
An essential rule of thumb is to keep the camera settings constant throughout the study, especially the sensor sensitivity (ISO) and aperture size (f). Therefore, the ideal solution is to set the camera to aperture priority mode (commonly referred to as A or Av), in which the value of both these parameters is fixed, and the camera automatically adjusts the exposure time. Choosing the correct exposure is crucial, as sometimes the camera may choose an exposure time that is too long (or short), and the photo is overexposed (or underexposed). In practice, this means that too much (or not enough) light has hit the camera’s sensor, and some pixels in the photo may no longer match the actual colouring. This problem can be solved by exposure correction, which either shortens the exposure time a little and thus darkens the image or prolongs the exposure and thus brightens it. A handy feature of many cameras is ‘Exposure Bracketing’, which allows taking several shots with different shutter speeds simultaneously. The most suitable one is then easily selected by checking the photo’s histogram or by using the ‘Photo Screening’ function in micaToolbox, showing all overexposed pixels in the images.
This brings me to the crucial point: ambient light conditions. Ideally, objects should be photographed under the lighting the studied subjects observe them. So, in most cases, we make do with sunlight, which emits a wide range of wavelengths, including, for example, UV light. Great care should be taken to remove unwanted shadows that could give a false impression of dark colouration in the photograph. This can be achieved by photographing in the shade and ideally using diffusion aids that scatter the sun’s harsh rays (e.g. a photo booth).
Preparing the photograph
The photo preparation procedure described here is already performed in ImageJ with the installed micaToolbox package and the names in brackets refer to specific commands. If we have selected a photo (visible and UV, or just visible), our first task will be to generate a so-called multispectral image (Generate Multispectral Image). This is a set of pictures showing the individual colour channels separately. We get information from a photograph taken in visible light for three colour channels (red=R, green=G and blue=B). If we also have a UV photograph, we also get two channels with UV reflectance information obtained from the red (UV) and blue (uvB) channels (Fig. 4). When creating a multispectral image, we manually align the visible and UV photographs so that they line up nicely (this is why it is essential to photograph the object in the same composition) and select the position of the grey standard placed in the photograph (Fig. 4).
After creating the multispectral image, a new file with the extension ‘.mspec’ will also be created. This file contains mainly information about the standard and is used to reload the multispectral image (Load Multispectral Image). It must remain in the same folder as the analysed image. The next step is to select the objects in the photograph for which you wish to explore the colour and pattern. The ImageJ control panel contains several tools for selecting points, lines and elliptical or polygonal shapes. Using these, we choose the region of the photo that interests us and press any letter to insert this object into the object manager (ROI Manager, ROI=Region of Interest). Since pattern analysis requires that all photos have the same scale (i.e. the same number of pixels per unit length), it is necessary to mark a scale on each image. This is done by selecting a line on an object of known size and pressing the “S” (Scale) key. To avoid re-marking all the objects in the photo again, press the “0” key on the character (and therefore not the separate numeric) keypad at the end. This creates another file (.zip) that contains the positions of all the objects of interest in the photo. This file must also remain in the same folder as the analysed photo. This completes the preparation of the image, and we can get down to the actual analysis of the colouration and pattern of our selected objects.
Colour analysis
To find out how different species perceive colours, we need to convert an open multispectral image into the visual system of the studied species. For this purpose, it is necessary to have a model (Generate Cone Mapping Model) using information about the sensitivity of the sensor of the camera used and the sensitivity of the cones of the species studied. The micaToolbox tool contains this information for several cameras and animal species. However, using another camera is not a problem. You can create your own model for a different camera. If accurate cone sensitivity data for the studied species are not (yet) available, it is possible to use data for its closest related species.
With the model created, we can now convert our original multispectral image to the visual system of the studied species (Convert to Cone Catch), in our case, the honeybee. A new image is created, this time consisting of channels that correspond to the sensitivity of each of the three types of bee cones. These are sensitive to 300–600 nm radiation, corresponding to green and blue light and UV radiation. In the image thus converted, we can quickly see how much each object in the photograph excites these three types of cones by pressing the “R” key. Therefore, the relative ratio of these three values informs us which kind of cone acquires the most information, thus creating the impression of the resulting colour. When all cone types are excited equally, the image is of a neutral (achromatic) greyscale colour. These results on the relative excitation of each cone type can already be used to objectively analyse the colour signals perceived by individuals of the studied species. However, if we want to compare how much the colours of two objects in a photograph (or in different pictures) differ, we first calculate these relative cone excitations using the Pattern Colour & Luminance Measurements tool (analysis of multiple photos at once is possible with the ‘Batch Multispectral Image Analysis’ function). The results will be displayed in the ‘Results’ table, and we will further analyse these with the ‘Colour JND Difference Calculator’ function.
The result will be the value of the chromatic (colour) contrast, indicating the difference in the colour of the two objects being compared. In psychophysics (the branch of psychology dealing with perception), a unit called JND (just-noticeable difference) is used to determine such differences, which indicates not only the degree of difference but also whether the observer can distinguish two stimuli (for example, two colours) from each other at all. Values less than 1 JND refer to two stimuli indistinguishable for the observer. At the same time, the higher the contrast (i.e., with higher JND values), the more distinct the stimuli appear to the observer. Analysis of the colour of Jerusalem artichoke petals showed that the bee could perceive a striking difference in the colour of the inner and outer parts of the petals due to its UV-sensitive vision (colour contrast = 47.8 JND, Fig. 5). This colour difference, on the other hand, remains completely invisible to human vision, as confirmed by analysis of the same photograph using a model containing human cone sensitivity data (colour contrast=0.5 JND, Fig. 5). Similarly, it is possible to calculate the difference between two colours in their intensity (luminance) or the so-called achromatic contrast (Luminance JND Difference Calculator). To perceive it, vertebrates probably use a combination of “red” and “green” cones or double cones in the case of birds. It seems that achromatic contrast may serve animals in, e.g. recognising objects in poorly lit environments, such as nesting cavities of birds (Langmore et al. 2009).
Pattern analysis
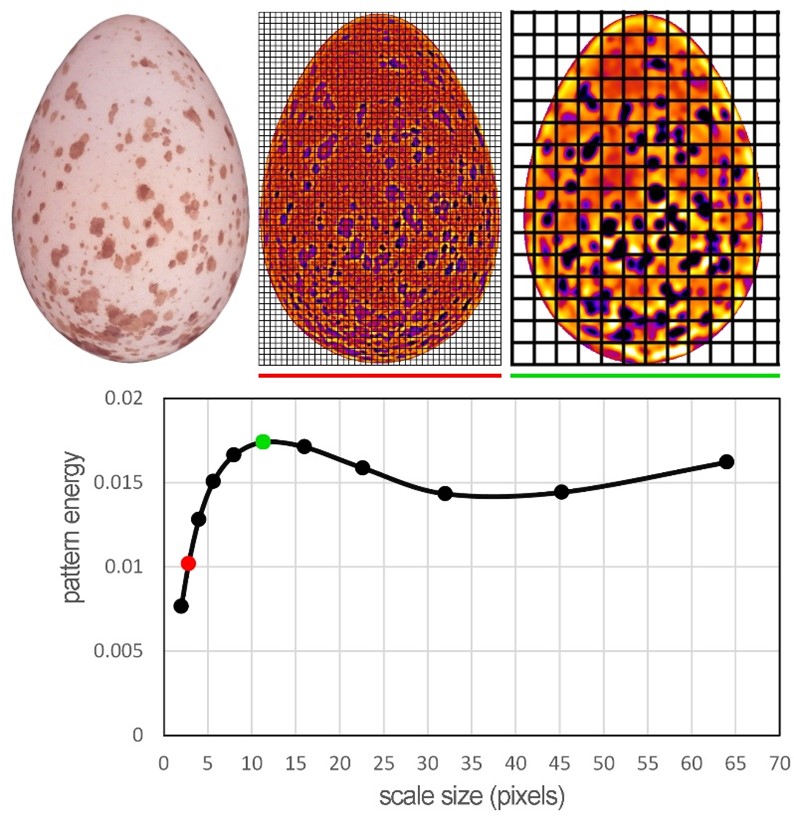
When the colouration of objects is more complicated, we do not have to be satisfied with evaluating the colour signal only. MicaToolbox also offers the possibility to analyse various patterns that are also fundamentally subject to evolution and play an essential role in the life of animals. Currently, the most common method of pattern analysis is called granularity analysis. This is again based on knowledge of how animals process basic pattern information, such as the amount and size of patches (Stoddard et al., 2019). The principle of the analysis is that each object in a photograph is “filtered” several times through a square mesh with different mesh sizes (Fig. 6). The so-called pattern energy is then calculated for each filter size, and it refers to the average variability (standard deviation) of pixel values across all filter meshes of a given size. The result is then an energy curve (pattern energy spectrum, Fig. 6) that, in our case with spotted eggs, describes how much the egg is spotted (energy takes on higher values) and what is the dominant spot size (the filter size where the energy takes on maximum values).
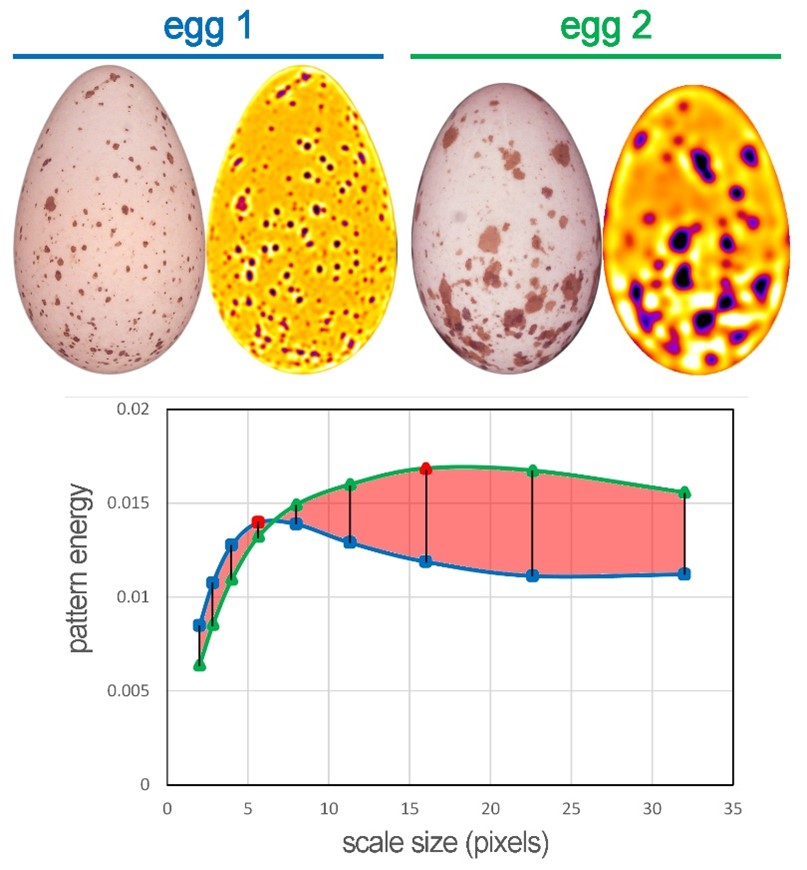
This analysis is run simultaneously with the previously mentioned colour analysis, and it is helpful to consider our image through the visual system of the studied species. Animals will likely use the same channel to process pattern information as they perceive achromatic contrast (see above), which must be ticked in the options menu. Suppose we want to analyse the pattern of objects captured in different photographs. In that case, it is also necessary to define a scale for each picture, which will unify the resolution of all photos. It is then easy to manually calculate the overall degree of difference between the two patterns as the area between the two curves (Figure 7), or again, micaToolbox (Pattern & Luminance Distribution Difference Calculator) can do this for us.
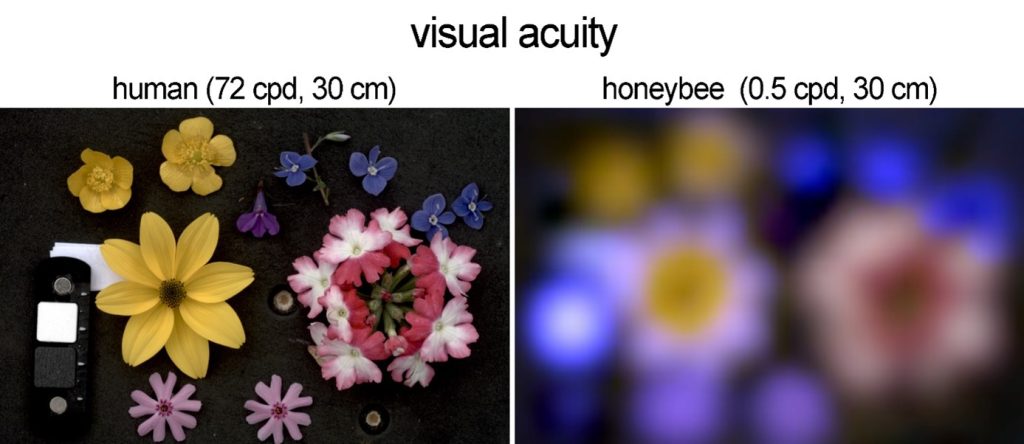
Another essential function is the possibility to adjust the photograph to the visual acuity of the studied species. We are familiar with testing our visual acuity at a general practitioner by recognising letters on the Snellen letter chart. Interestingly, most animal species would fail such a test. Different species vary significantly in the acuity of their vision. The main parameters that sharpen vision are the higher density of photoreceptor cells on the eye’s retina and the longer focal length of the photoreceptor cells from the lens. Since increasing the focal length is only possible by increasing the size of the eye, it is not surprising that it is primarily larger species with bigger eyes that can enjoy the sharpest images (Caves et al. 2018). The degree of acuity is measured in cycles per degree (cycles per degree=cpd), indicating how many black bars on a white background the eye can resolve in one degree of visual angle (approximately the width of the thumb of the arm extended in front of eyes). Humans can resolve about 72 such black-and-white cycles, making us the species with nearly the sharpest vision among all animals. To date, only a few species of birds of prey in the hawk (Accipitridae) and falcon (Falconidae) families are known to have even sharper vision than humans. However, most species cannot distinguish even ten cycles per degree, which equates to legal blindness in humans (Caves et al., 2018).
Humans have exceptionally sharp vision compared to other species. Therefore, it is essential to consider what details the studied species can still see and what elements can no longer be perceived when making hypotheses about the signal functions of the observed pattern. Again, this can be done using the micaToolbox tool and its Acuity View function that was introduced by the QCPA, which adjusts the entire photograph based on the specified information about the visual acuity of the studied species (a list of acuity values for many species is available at www.empiricalimaging.com or in Caves et al. 2018). Because the ability to perceive fine details of the pattern decreases with increasing distance from the observed pattern, it is also important to specify the distance of the observer from the observed object. For this reason, a prerequisite for performing the visual acuity correction is to have the scale marked on the image. After the correction has been applied, the program will produce a new image that will appear somewhat blurrier than the original one (Fig. 8). This is because the program has removed details from the image that the studied species can no longer perceive. This blurred image is then ideal for the pattern analysis perceived by individuals of the studied species that I described above.
The future of the field
In conclusion, it should be noted that vision, and especially the subsequent processing of images in the brain, is highly complicated, and science constantly provides new information about these processes. For example, it appears that many animals process optical stimuli in an even more complex way, for example, by increasing their perception of the edges of objects (edge detection). Therefore, we should not be satisfied with simplistic ideas such as animals with less sharp vision perceiving the world around them in a blurred way. The reality is likely to be a bit more complex. Still, the freely available and continuously developed animal vision modelling tool micaToolbox tries to deal with these challenges (yes, even reconstruction of sharp edges of objects is possible in the program as part of the QCPA workflow). Growing knowledge of the visual and nervous system thus allows us to understand better how other species of animals perceive the world with their own eyes. We can be sure that the information stored in digital photographs will lead to many more exciting discoveries and that the field of sensory ecology has a fruitful future ahead.
Funding and Acknowledgments
This article was supported by the Czech Grant Agency (project 20-06110Y) and the Programme for Research and Mobility of Young Scientists of the CAS (MSM200931801). I would like to thank A. Hughes, J. Troscianko, and C. van den Berg for their patience to help me use and understand MICA Toolbox. C. van den Berg also proofread this translated English version.
Citing the article
This is a translation of my original article published in the Czech popularisation journal Živa. If you wish to cite it, please cite the original Czech article as:
Šulc M. 2022. Studying colours and patterns in biology using photography. Živa 3:149–152.
References
Bennett ATD, Cuthill IC. 1994. Ultraviolet vision in birds: What is its function? Vision Research. 34(11):1471–1478. doi:10.1016/0042-6989(94)90149-X.
van den Berg CP, Troscianko J, Endler JA, Marshall NJ, Cheney KL. 2020. Quantitative Colour Pattern Analysis (QCPA): A comprehensive framework for the analysis of colour patterns in nature. Methods Ecol Evol. 11(2):316–332.
Briolat ES, Gaston KJ, Bennie J, Rosenfeld EJ, Troscianko J. 2021. Artificial nighttime lighting impacts visual ecology links between flowers, pollinators and predators. Nat Commun. 12(1):4163. doi:10.1038/s41467-021-24394-0.
Caves EM, Brandley NC, Johnsen S. 2018. Visual Acuity and the Evolution of Signals. Trends Ecol Evol. 33(5):358–372. doi:10.1016/j.tree.2018.03.001.
Cronin TW, Bok MJ. 2016. Photoreception and vision in the ultraviolet. J Exp Biol. 219(18):2790–2801. doi:10.1242/jeb.128769.
Kane SA, Wang Y, Fang R, Lu Y, Dakin R. 2019. How conspicuous are peacock eyespots and other colorful feathers in the eyes of mammalian predators? PLOS ONE. 14(4):e0210924. doi:10.1371/journal.pone.0210924.
Langmore NE, Stevens M, Maurer G, Kilner RM. 2009. Are dark cuckoo eggs cryptic in host nests? Anim Behav. 78(2):461–468. doi:10.1016/j.anbehav.2009.06.003.
Nokelainen O, Scott-Samuel NE, Nie Y, Wei F, Caro T. 2021. The giant panda is cryptic. Sci Rep. 11(1):21287. doi:10.1038/s41598-021-00742-4.
Schneider CA, Rasband WS, Eliceiri KW. 2012. NIH Image to ImageJ: 25 years of image analysis. Nat Methods. 9(7):671.
Stoddard MC, Hogan BG, Stevens M, Spottiswoode CN. 2019. Higher-level pattern features provide additional information to birds when recognizing and rejecting parasitic eggs. Philos Trans R Soc B Biol Sci. 374(1769):20180197. doi:10.1098/rstb.2018.0197.
Šulc M, Hughes AE, Troscianko J, Štětková G, Procházka P, Požgayová M, Piálek L, Piálková R, Brlík V, Honza M. 2021. Automatic identification of bird females using egg phenotype. Zool J Linn Soc.:zlab051. doi:10.1093/zoolinnean/zlab051.
Troscianko J, Stevens M. 2015. Image calibration and analysis toolbox–a free software suite for objectively measuring reflectance, colour and pattern. Methods Ecol Evol. 6(11):1320–1331.
Van Der Kooi CJ, Stavenga DG, Arikawa K, Belušič G, Kelber A. 2021. Evolution of insect color vision: from spectral sensitivity to visual ecology. Annu Rev Entomol. 66(10.1146).
Wilder K. 2009. Photography and science. Reaktion books.