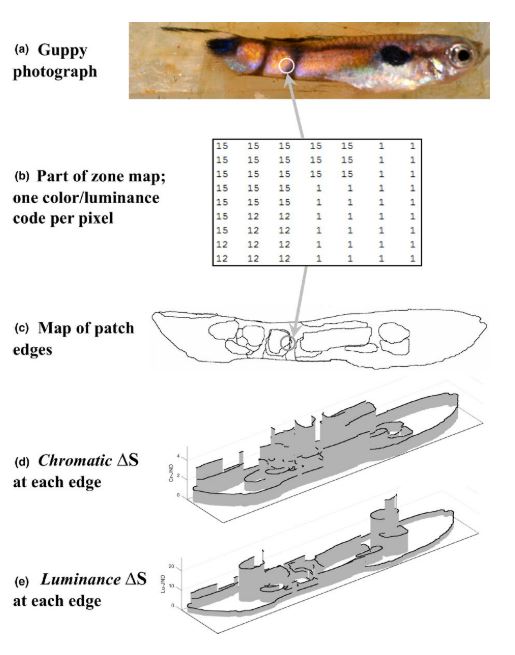
The Boundary Strength Analysis (BSA) is essentially a combination and extention of both the Adjacency Analyis and the Visual Contrast Analysis, published by John Endler et al. in 2018 using Matlab. It uses the off-diagonal of the transition matrix to identifiy the properties of boundaries between colour pattern elements inside a colour pattern (See Adjacency Analysis). The length (relative abundance of off-diagonal transitions) of the boundaries in combination with their chromatic and achromatic contrast can then be used to describe if and how a colour pattern provides visual contrast through its internal borders. This can be statistically represented using a similar statistical approach as the Visual Contrast Analysis (e.g. Coefficients of Variation). We have adapted BSA as it was published but have systematically avoided the use of angular chromaticity metrics and have replaced them with euclidian distances in the log-transformed RNL colour space. We have also added parameters which are not presented in the original publication but may add additional insights. Please see the supplement of our publication for detailed parameter explanations and equations.