
Colour measurements have historically been plotted and compared as single points in a colour space (such as a Maxwell triangle, or a tetrahedral colour space). The area or volumes occupied by these average colour points has also been used to quantify colour differences between samples. However, natural objects will effectively never have a truly “flat” colour (this would require a perfectly flat surface, perfectly Lambertian reflectance, and perfectly diffuse light source).
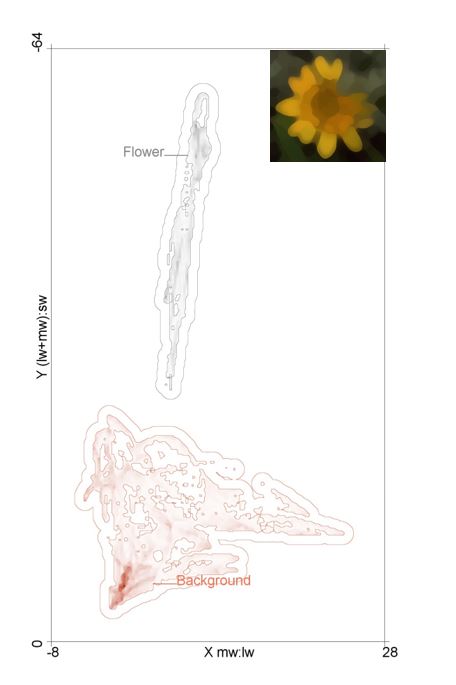
We have developed colour maps which can plot the thousands or even millions of different colours present in any image region using the RNL colour space and acuity correction. In addition, these colour maps can be used to quantify the overlap in colour between measurements. Unlike other methods, these colour maps are non-parametric, so no assumptions are made about the underlying error structure in the measurements (the full range of hues and noise is captured), while using a psychophysically calibrated colour space.
Video Guide
Input Requirements:
We recommend using the RNL ranked filtered image for measuring colour maps because these preserve sharp edges and gradients, while having controlled for spatial acuity. However, colour maps can be created from any cone capture image stack which can be either untreated (original resolution), acuity modelled (blurry), or RNL clustered images.
To translate cone captures into RNL colour space it is necessary that channel specific noise levels (Weber fractions) are known for all chromatic channels. Colour maps automatically ignore the luminance channel.
Consider whether your measurement should be made independently of its surroundings. If required, run the QCPA framework and use the Gaussian Acuity Control method and specify the ROI which should be measured independently of its background.
Creating Colour Maps:
When going to plugins > micaToolbox > RNL Colour Maps you will find three options:
- Create RNL colour maps from ROI
- Combine RNL colour maps
- Plot and compare RNL colour maps
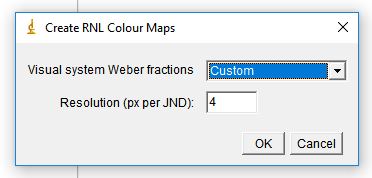
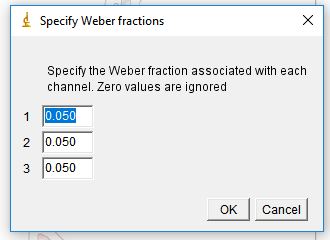
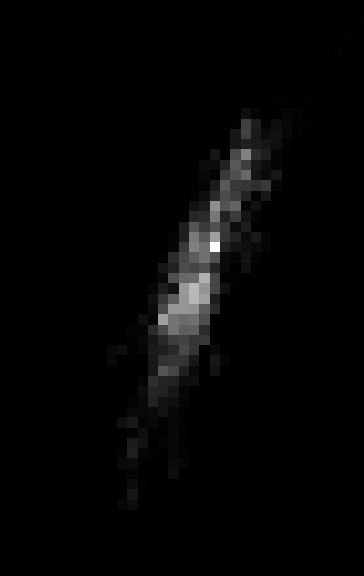
‘Create RNL colour maps from ROI’ requires either an entire picture or an ROI that has been saved to the ROI manager. It uses the available cone catch image stack to create a single colour map which is a grey scale intensity image that does not contain any axes but already shows the distribution of pixels in the log transformed RNL colour space with the intensity representing the amount of pixels in an ROI sharing the same coordinates. The user is first prompted to enter the respective Weber fractions that correspond to the chromatic channels in the selected ROI. The can be entered manually or taken from a pre-defined file. The channel names specified in the pre-defined files must match the slice labels in the cone-catch image (it will show an error if they do not match). The user can define the resolution of the colour map in pixels per JND. We recommend the default value of 4 unless you have specific requirements.
Next, the user is asked to select a folder to which the colour map is stored. Once a folder is selected or created, the user gets asked to enter the Weber fractions (if ‘Custom’ was chosen). Use this step to check that the luminance channel is ignored or set it to 0 if it is displayed. QCPA is automatically ignores the last layer of an image stack, assuming it to be the luminance channel. Any other channel can also be ignored by setting it to 0 (e.g. if you want to ignore the UV channel). The colour map of each ROI is then saved to the selected folder as well as displayed as grey-scale intensity image.
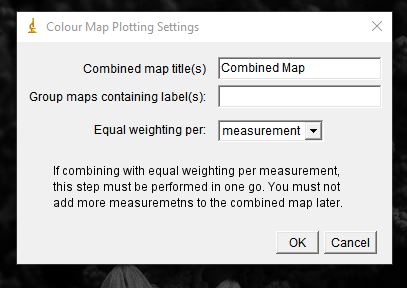
‘Combine RNL colour maps’ allows the user to combine colour maps from different ROIs. i.e. this may be used when having multiple colour maps of the same body part from different animals.
‘Plot and compare RNL colour maps’ allows the user to plot single or multiple colour maps and measure overlap in colour space.
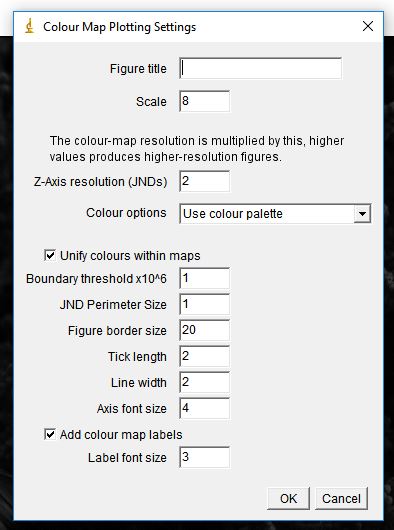
The user can define the plotting parameters, particularly the axes properties, a JND perimeter and the colour of the colour maps. Once the parameters are set, the user then needs to choose the folder that contains the colour maps which then creates a figure such as the one at the very top of this article.