
Using a standard colour chart it is possible to create a cone-catch model. This method requires:
- A diffuse colour chart with precisely known spectral reflectance curves (the toolbox provides these curves for an X-Rite colorChecker passport). A .csv file containing the reflectance curves should be placed in imagej/plugins/Cone Mapping/Charts, reading the values in from top left to bottom right, one row at a time (see the existing example for the required format). Note that this method is incredibly sensitive to errors in reflectance intensity, so a standard spectrometer probe is not sufficient for measuring these curves (tiny differences in the distance from the probe to the surface will create unacceptable levels of measurement error). We measured the chart using natural sunlight and a spectroradiometer, although integration spheres may also provide suitable measurements.
- A known illumination spectrum. This method currently requires the chart to be photographed under the same illumination spectrum as that which is being modelled. Natural daylight in all but the deepest forests will conform to the CIE standard illumination curves well enough to use that in almost all situations (e.g. D65). Any variation from this spectral curve in normal daylight terrestrial conditions is likely to be controlled for sufficiently by the normalisation process.
- Linear, normalised images of the chart. If RAW photos are not available then a linearisation model for your camera must be made first.
Video Guide
Process
- Photograph the chart as described above.
- Load the photograph as a calibrated multispectral image.
- To measure the chart values go plugins > micaToolbox > Camera Calibration > Measure Chart.
- Follow the on-screen instructions for measuring the chart values. Note that the chart values are read from top left to bottom right (like reading a book), and the positioning of each point is important.
- Save the chart measurements (e.g. as a .csv file).
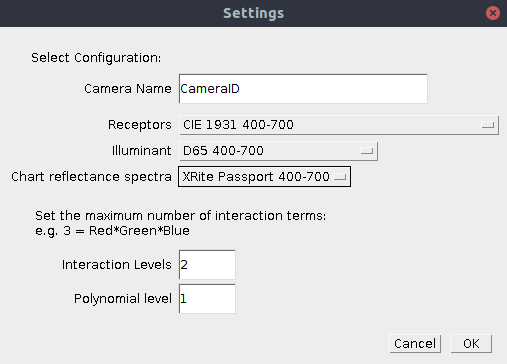
- Run plugins > micaToolbox > Camera Calibration > Generate Cone Mapping Model from Chart.
- Choose the desired settings, ensuring the wavelength ranges (400-700nm or 300-700nm) are the same for each of the options. Note that the name must not start with a number (this interferes with the java compilation).
- Check the resulting model R^2 values are appropriate (ideally >0.98). If the values are much lower then something has gone wrong (linearisation not perfect, chart measurement not perfect, or shadows/lens artefacts degrading the quality of the chart photo).
Ultraviolet Camera Calibration
This chart-based method can be used for ultraviolet-visible camera calibration. However, you will not be able to use a standard colour-chart (because these are only developed for human-visible colour calibration, and use UV-protective additives, which block UV reflectance). In practice the easiest method is to buy a set of cheap artist’s colouring pastels (e.g. Inscribe Soft Pastel Set of 64 pastels). Pastels are ideal because the pigments used have varied and interesting UV reflectance curves (there do not appear to be UV-blocking additives in the sets we have used), plus pastels are very diffuse, and are already in a chart layout. To use these pastels as a colour chart you should clean each pastel well (using a clean piece of paper to wear down one side of the pastel and ensure it is uniform and diffuse). Some pastels contain fluorescent dyes and these must not be used (they will interfere with the light source). Use a UV LED torch to identify any fluorescent pastels and remove them. Then measure the reflectance of each pastel. As above, this measurement needs to be incredibly accurate, and a standard spectrometer probe is not sufficient.