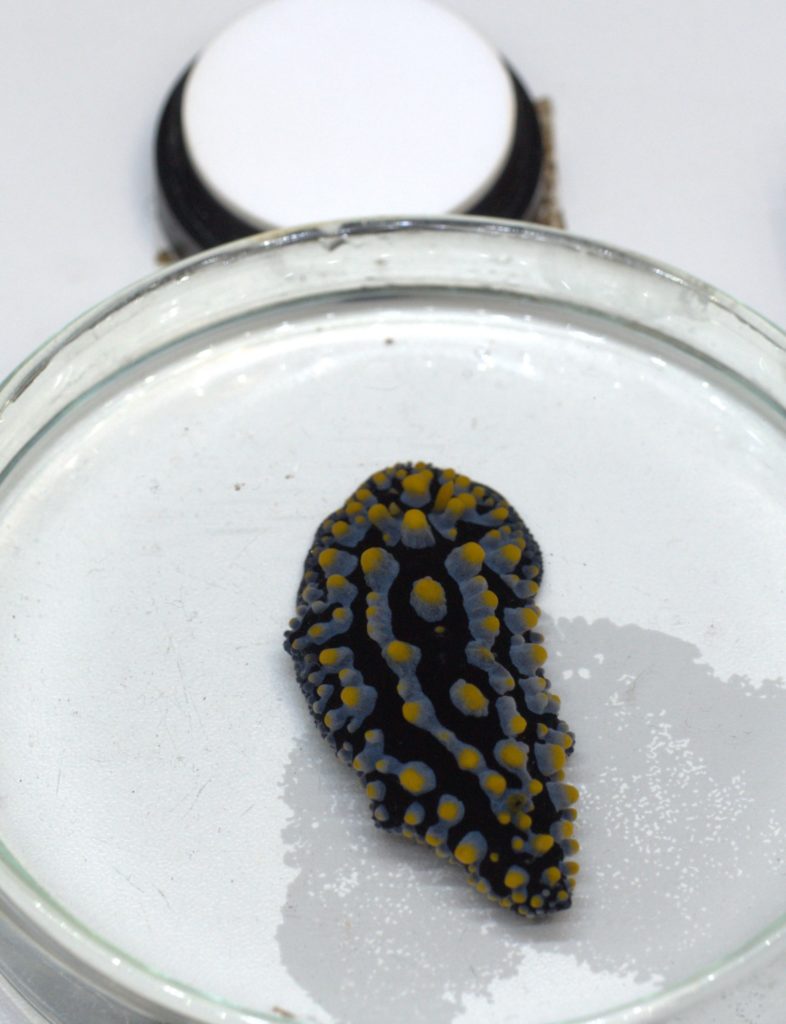
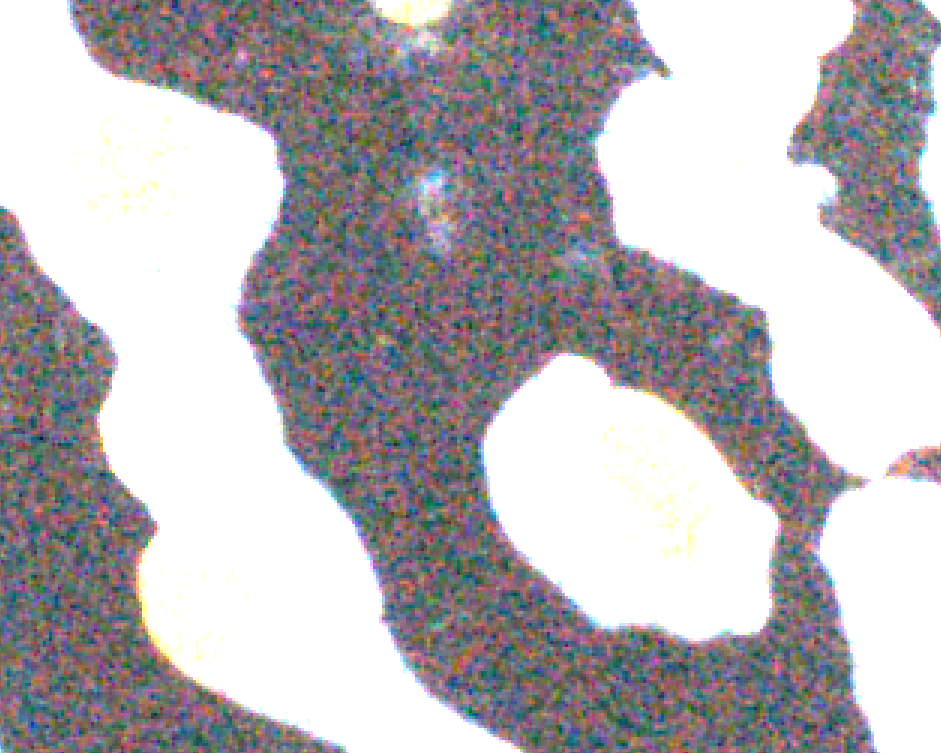
We have introduced a “desaturation function” (v2.1.0) to overcome the common problem where strong chromatic signals are detected in very dark parts of a scene. The tool is accessed when converting images to cone-catch (plugins > micaToolbox > Convert to Cone Catch). The tool searches for any pixels in the image where the average cone-catch quanta are below the user-set threshold. The values at this pixel are then set to the average across all channels (converting them to an achromatic ‘true’ grey).
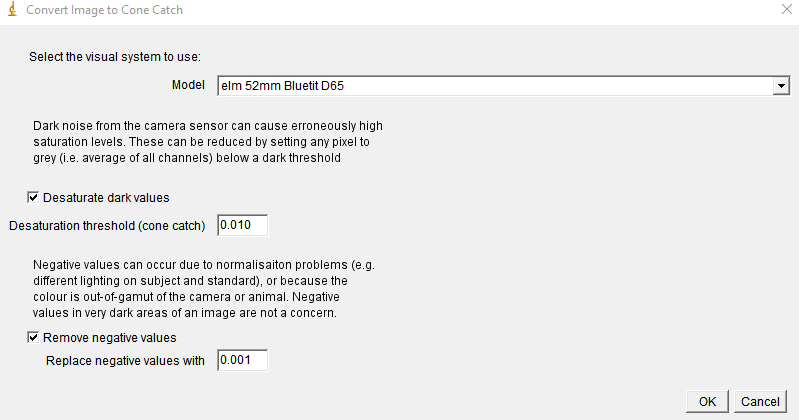
Choosing a sensible threshold based on biological criteria is difficult, as explained below. It is easier to estimate the dark noise of the camera, e.g. by placing an extremely dark object into an image. Such an object could be a hollow object with a small hole in the top, with its inside coated in matte black velvet or paint (e.g. ultrablack paint). The hole in the top of this object will have an extremely low radiance, and be very close to true black. Based on preliminary experiences with fairly noisy cameras and working in an underwater environment, a threshold of between 1-3% seems reasonable but this should be estimated on a case to case base.
Background:
The receptor noise-limited model (RNL) only considers the relative stimulation of different receptor classes, and therefore ignores all luminance information. While this colour opponency system does occur at the earliest stages of visual processing (Hurvich & Jameson 1957), there is considerable evidence that achromatic information (e.g. ‘luminance’, ‘brightness’, and ‘lightness’) affects both retinal and post-retinal stages of chromatic visual perception.
The RNL model’s reliance on relative receptor stimulation means that it becomes vulnerable to noise near the low end of the dynamic range (dark regions) where tiny differences in absolute levels of stimulation can create wildly different relative stimulations. For example, where a viewer might describe a colour as “black” (and therefore achromatic), the model may detect large relative differences in stimulation caused by noise, leading to the conclusion that two points within that black region are dramatically different colours. This can have a fundamental impact on data analysis and subsequent conclusions, e.g. when dark parts of an image or animal suddenly report a ΔS of far above discrimination threshold (JND).
The reason why this is unwanted is that, naturally, there’s a limit to the perception of colour. For one, there’s a limit due to the absolute levels of light in a visual scene which determines whether photopic vision using cone photoreceptors is even possible (Cronin, Johnsen, Marshall, & Warrant, 2014). Second, and more importantly, even under well-lit (photopic) conditions (which is what MICA is currently designed to work with), there is a certain level of luminance for a given part of the image (e.g. a dark patch on an animal or a shadow) below which a sensation of colour is unrealistic. At some point, even a dark blue is just black.
However, what that threshold is, likely depends on various properties of a given visual system (static and dynamic contrast capacity, receptor noise, receptor abundances, spatial and temporal properties of receptive fields, adaptation, etc.) and viewing context (colour pattern size, illuminant, motion, background colour, dynamic contrast and static contrast present in subsections or the entirety of a visual scene, etc..). In short, it really depends. We’ll explain what that means for the use of the RNL model in MICA, but first some explanation on the technical origin of unwanted chromaticity in calibrated images.
Camera sensors detect light with some degree of noise. Much like eyes and all other light-sensitive equipment, the camera’s dynamic range describes the range of light intensity values where the sensor behaves linearly with radiance (plus some degree of noise), and at the bottom of this range (near the black point) there is additional noise, because the sensor doesn’t know exactly what level of stimulation is caused by no light (due to the dark current). This noise can be asymmetric across the camera’s RGB channels (e.g. more noise in G than R and B), and is influenced by camera type, ISO and exposure. Aside from the sensor, further effects can amplify noise near the dark point, such as imperfect normalisation (e.g. caused by lighting or atmospheric/turbidity effects), grey standard calibration, or linearisation. All of this can cause the micaToolbox processing workflow to detect chromatic signals where there shouldn’t be any.
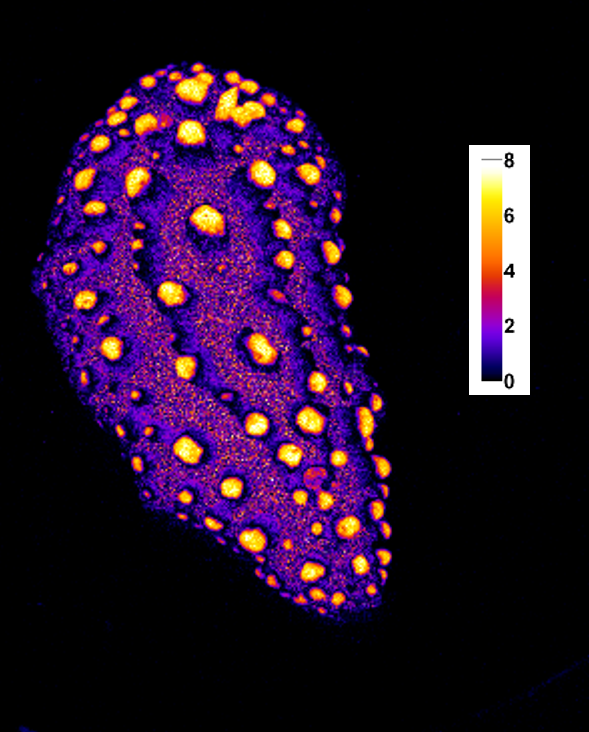
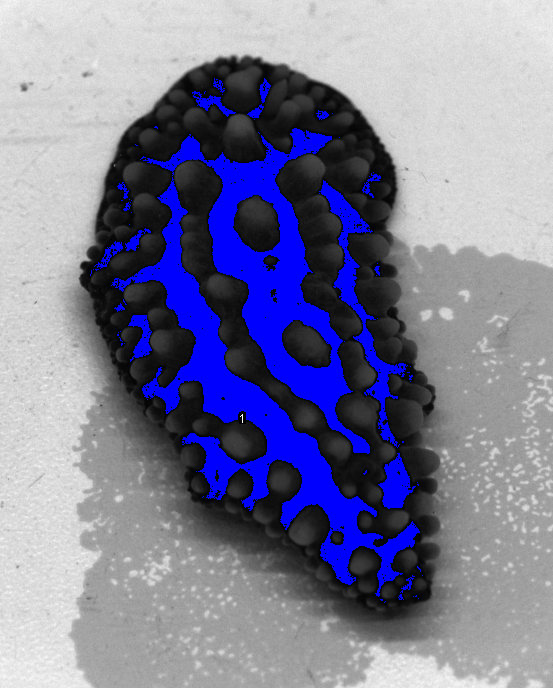
In the case of issues (counter-intuitive results) with ‘dark chromaticity’ above 5% average stimulation we recommend carefully re-evaluating the adequacy of cone catch models, grey standards, camera settings and image lighting.
References
Cronin, T. W., Johnsen, S., Marshall, N. J., & Warrant, E. (2014). Visual Ecology. Journal of Chemical Information and Modeling (Vol. 53). Princeton, N.J: Princeton University Press. doi:10.1017/CBO9781107415324.004
Hurvich, L. M., & Jameson, D. (1957). An opponent-process theory of color vision. Psychological Review, 64(6 PART 1), 384–404. doi:10.1037/h0041403

